MetLife 2009 Annual Report Download - page 38
Download and view the complete annual report
Please find page 38 of the 2009 MetLife annual report below. You can navigate through the pages in the report by either clicking on the pages listed below, or by using the keyword search tool below to find specific information within the annual report.-
 1
1 -
2
-
3
-
4
-
5
-
6
-
7
-
8
-
9
-
10
-
11
-
12
-
13
-
14
-
15
-
16
-
17
-
18
-
19
-
20
-
21
-
22
-
23
-
24
-
25
-
26
-
27
-
 28
28 -
 29
29 -
 30
30 -
 31
31 -
 32
32 -
 33
33 -
 34
34 -
 35
35 -
 36
36 -
 37
37 -
 38
38 -
 39
39 -
 40
40 -
 41
41 -
 42
42 -
 43
43 -
 44
44 -
 45
45 -
 46
46 -
 47
47 -
 48
48 -
49
-
50
-
51
-
52
-
53
-
54
-
55
-
56
-
57
-
58
-
59
-
60
-
61
-
62
-
63
-
64
-
65
-
66
-
67
-
68
-
69
-
70
-
71
-
72
-
73
-
74
-
75
-
76
-
77
-
78
-
79
-
80
-
81
-
82
-
83
-
84
-
85
-
86
-
87
-
88
-
89
-
90
-
91
-
92
-
93
-
94
-
95
-
96
-
97
-
98
-
99
-
100
-
101
-
102
-
103
-
104
-
105
-
106
-
107
-
108
-
109
-
110
-
111
-
112
-
113
-
114
-
115
-
116
-
117
-
118
-
119
-
120
-
121
-
122
-
123
-
124
-
125
-
126
-
127
-
128
-
129
-
130
-
131
-
132
-
133
-
134
-
135
-
136
-
137
-
138
-
139
-
140
-
141
-
142
-
143
-
144
-
145
-
146
-
147
-
148
-
149
-
150
-
151
-
152
-
153
-
154
-
155
-
156
-
157
-
158
-
159
-
160
-
161
-
162
-
163
-
164
-
165
-
166
-
167
-
168
-
169
-
170
-
171
-
172
-
173
-
174
-
175
-
176
-
177
-
178
-
179
-
180
-
181
-
182
-
183
-
184
-
185
-
186
-
187
-
188
-
189
-
190
-
191
-
192
-
193
-
194
-
195
-
196
-
197
-
198
-
199
-
200
-
201
-
202
-
203
-
204
-
205
-
206
-
207
-
208
-
209
-
210
-
211
-
212
-
213
-
214
-
215
-
216
-
217
-
218
-
219
-
220
 |
 |

and asset allocation. For real estate and agricultural assets, the Company manages credit risk and market valuation risk through geographic,
property type and product type diversification and asset allocation. The Company manages interest rate risk as part of its asset and liability
management strategies; product design, such as the use of market value adjustment features and surrender charges; and proactive
monitoring and management of certain non-guaranteed elements of its products, such as the resetting of credited interest and dividend rates
for policies that permit such adjustments. The Company also uses certain derivative instruments in the management of credit and interest rate
risks.
Current Environment. Precipitated by housing sector weakness and severe market dislocations, the U.S. economy entered its worst
post-war recession in January 2008. Most economists believe this recession ended in third quarter 2009 when positive growth returned.
Most economists now expect positive growth to continue through 2010. However, the expected recovery is weaker than normal, and the
unemployment rate is expected to remain high for some time. Although the disruption in the global financial markets has moderated, not all
global financial markets are functioning normally, and many remain reliant upon government intervention and liquidity.
As a result of this unprecedented disruption and market dislocation, we have experienced both volatility in the valuation of certain
investments and decreased liquidity in certain asset classes. Securities that are less liquid are more difficult to value and have fewer
opportunities for disposal. Even some of our very high quality assets have been more illiquid for periods of time as a result of the recent
challenging market conditions. These market conditions had also led to an increase in unrealized losses on fixed maturity and equity securities
in recent quarters, particularly for residential and commercial mortgage-backed, asset-backed and corporate fixed maturity securities and
within the Company’s financial services industry fixed maturity and equity securities holdings. During 2009, unrealized losses on fixed maturity
and equity securities decreased from improving market conditions, including narrowing of credit spreads reflecting an improvement in
liquidity.
Investment Outlook
Although we anticipate that the volatility in the equity, credit and real estate markets will moderate slightly in 2010, it could continue to
impact net investment income and the related yields on private equity funds, hedge funds and real estate joint ventures, included within our
other limited partnership interests and real estate and real estate joint venture portfolios. Further, in light of the current market conditions,
liquidity will be reinvested in a prudent manner and invested according to our asset-liability management discipline in appropriate assets over
time. Until the additional liquidity is reinvested, the Company will have a slightly higher than normal level of short-term liquidity. Net investment
income may be adversely affected if the reinvestment process occurs over an extended period of time due to challenging market conditions or
asset availability.
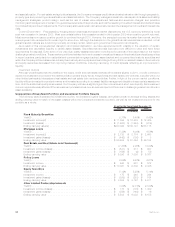
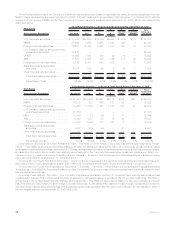
Composition of Investment Portfolio and Investment Portfolio Results
The following table illustrates the investment income, net investment gains (losses), annualized yields on average ending assets and
ending carrying value for each of the asset classes within the Company’s investment portfolio, as well as net investment income for the
portfolio as a whole:
2009 2008 2007
At and for the Years Ended December 31,
(In millions)
Fixed Maturity Securities
Yield(1).................................................. 5.77% 6.40% 6.42%
Investmentincome(2) ........................................ $ 11,899 $ 12,403 $ 12,425
Investment(losses).......................................... $ (1,663) $ (1,953) $ (615)
Endingcarryingvalue(2)....................................... $230,026 $189,197 $233,115
Mortgage Loans
Yield(1).................................................. 5.38% 6.08% 6.56%
Investmentincome(3) ........................................ $ 2,735 $ 2,774 $ 2,648
Investmentgains(losses)...................................... $ (442) $ (136) $ 3
Endingcarryingvalue ........................................ $ 50,909 $ 51,364 $ 46,154
Real Estate and Real Estate Joint Ventures(4)
Yield(1).................................................. (7.47)% 2.98% 10.29%
Investmentincome(losses)..................................... $ (541) $ 217 $ 607
Investmentgains(losses)...................................... $ (156) $ (9) $ 59
Endingcarryingvalue ........................................ $ 6,896 $ 7,586 $ 6,767
Policy Loans
Yield(1).................................................. 6.54% 6.22% 6.21%
Investmentincome .......................................... $ 648 $ 601 $ 572
Endingcarryingvalue ........................................ $ 10,061 $ 9,802 $ 9,326
Equity Securities
Yield(1).................................................. 5.12% 5.25% 5.14%
Investmentincome .......................................... $ 175 $ 249 $ 244
Investmentgains(losses)...................................... $ (399) $ (253) $ 164
Endingcarryingvalue ........................................ $ 3,084 $ 3,197 $ 5,911
Other Limited Partnership Interests
Yield(1).................................................. 3.22% (2.77)% 27.09%
Investmentincome(losses)..................................... $ 173 $ (170) $ 1,309
Investmentgains(losses)...................................... $ (356) $ (140) $ 16
Endingcarryingvalue ........................................ $ 5,508 $ 6,039 $ 6,155
32 MetLife, Inc.