MetLife 2009 Annual Report Download - page 130
Download and view the complete annual report
Please find page 130 of the 2009 MetLife annual report below. You can navigate through the pages in the report by either clicking on the pages listed below, or by using the keyword search tool below to find specific information within the annual report.-
 1
1 -
2
-
3
-
4
-
5
-
6
-
7
-
8
-
9
-
10
-
11
-
12
-
13
-
14
-
15
-
16
-
17
-
18
-
19
-
20
-
21
-
22
-
23
-
24
-
25
-
26
-
27
-
28
-
29
-
30
-
31
-
32
-
33
-
34
-
35
-
36
-
37
-
38
-
39
-
40
-
41
-
42
-
43
-
44
-
45
-
46
-
47
-
48
-
49
-
50
-
51
-
52
-
53
-
54
-
55
-
56
-
57
-
58
-
59
-
60
-
61
-
62
-
63
-
64
-
65
-
66
-
67
-
68
-
69
-
70
-
71
-
72
-
73
-
74
-
75
-
76
-
77
-
78
-
79
-
80
-
81
-
82
-
83
-
84
-
85
-
86
-
87
-
88
-
89
-
90
-
91
-
92
-
93
-
94
-
95
-
96
-
97
-
98
-
99
-
100
-
101
-
102
-
103
-
104
-
105
-
106
-
107
-
108
-
109
-
110
-
111
-
112
-
113
-
114
-
115
-
116
-
117
-
118
-
119
-
 120
120 -
 121
121 -
 122
122 -
 123
123 -
 124
124 -
 125
125 -
 126
126 -
 127
127 -
 128
128 -
 129
129 -
 130
130 -
 131
131 -
 132
132 -
 133
133 -
 134
134 -
 135
135 -
 136
136 -
 137
137 -
 138
138 -
 139
139 -
 140
140 -
141
-
142
-
143
-
144
-
145
-
146
-
147
-
148
-
149
-
150
-
151
-
152
-
153
-
154
-
155
-
156
-
157
-
158
-
159
-
160
-
161
-
162
-
163
-
164
-
165
-
166
-
167
-
168
-
169
-
170
-
171
-
172
-
173
-
174
-
175
-
176
-
177
-
178
-
179
-
180
-
181
-
182
-
183
-
184
-
185
-
186
-
187
-
188
-
189
-
190
-
191
-
192
-
193
-
194
-
195
-
196
-
197
-
198
-
199
-
200
-
201
-
202
-
203
-
204
-
205
-
206
-
207
-
208
-
209
-
210
-
211
-
212
-
213
-
214
-
215
-
216
-
217
-
218
-
219
-
220
 |
 |

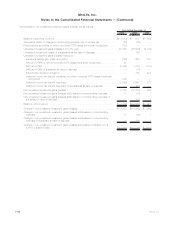
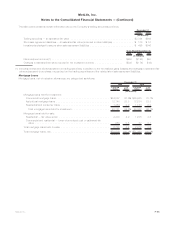
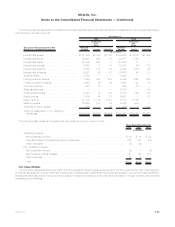
Mortgage Loans by Geographic Region and Property Type — The Company diversifies its mortgage loans by both geographic region and
property type to reduce risk of concentration. Mortgage loans are collateralized by properties primarily located in the United States. The
carrying value of the Company’s mortgage loans located in California, New York and Texas were 20%, 7% and 6% at December 31, 2009,
respectively. Generally, the Company, as the lender, only loans up to 75% of the purchase price of the underlying real estate. Commercial
mortgage loans at December 31, 2009 and 2008 were $35,176 million and $36,197 million, respectively, or 68.1% and 72.9%, respectively,
of total mortgage loans prior to valuation allowances. Net of valuation allowances commercial mortgage loans were $34,587 million and
$35,965 million, respectively, at December 31, 2009 and 2008 and there was diversity across geographic regions and property types as
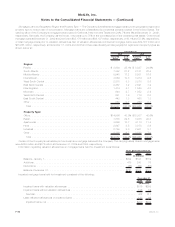
shown below at:
Carrying
Value %of
Total Carrying
Value %of
Total
2009 2008
December 31,
(In millions)
Region:
Pacific ................................................ $ 8,684 25.1% $ 8,837 24.6%
SouthAtlantic ........................................... 7,342 21.2 8,101 22.5
MiddleAtlantic........................................... 5,948 17.2 5,931 16.5
International............................................. 3,564 10.3 3,414 9.5
WestSouthCentral........................................ 2,870 8.3 3,070 8.5
EastNorthCentral ........................................ 2,487 7.2 2,591 7.2
NewEngland............................................ 1,414 4.1 1,529 4.3
Mountain .............................................. 944 2.7 1,052 2.9
WestNorthCentral........................................ 641 1.9 716 2.0
EastSouthCentral ........................................ 443 1.3 468 1.3
Other................................................. 250 0.7 256 0.7
Total . . . . . . . . . . . . . . . . . . . . . . . . . . . . . . . . . . . . . . . . . . . . . . . . $34,587 100.0% $35,965 100.0%
Property Type:
Office................................................. $14,986 43.3% $15,307 42.6%
Retail................................................. 7,870 22.8 8,038 22.3
Apartments............................................. 3,696 10.7 4,113 11.4
Hotel ................................................. 2,947 8.5 3,078 8.6
Industrial............................................... 2,759 8.0 2,901 8.1
Other................................................. 2,329 6.7 2,528 7.0
Total . . . . . . . . . . . . . . . . . . . . . . . . . . . . . . . . . . . . . . . . . . . . . . . . $34,587 100.0% $35,965 100.0%
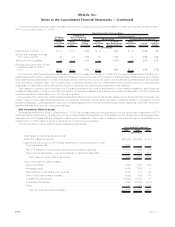
Certain of the Company’s real estate joint ventures have mortgage loans with the Company. The carrying values of such mortgage loans
were $368 million and $372 million at December 31, 2009 and 2008, respectively.
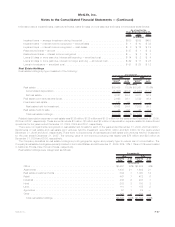
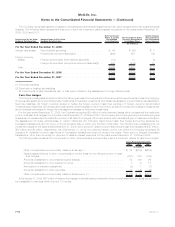
Information regarding valuation allowances on mortgage loans held-for-investment is as follows:
2009 2008 2007
Years Ended December 31,
(In millions)
Balance,January1,................................................. $304 $197 $182
Additions........................................................ 475 200 76
Deductions ...................................................... (58) (93) (61)
Balance,December31, .............................................. $721 $304 $197
Impaired mortgage loans held-for-investment consisted of the following:
2009 2008
December 31,
(In millions)
Impairedloanswithvaluationallowances .......................................... $316 $259
Impairedloanswithoutvaluationallowances ........................................ 106 52
Subtotal.............................................................. 422 311
Less:Valuationallowancesonimpairedloans ....................................... 123 69
Impairedloans,net....................................................... $299 $242
F-46 MetLife, Inc.
MetLife, Inc.
Notes to the Consolidated Financial Statements — (Continued)