MetLife 2009 Annual Report Download - page 31
Download and view the complete annual report
Please find page 31 of the 2009 MetLife annual report below. You can navigate through the pages in the report by either clicking on the pages listed below, or by using the keyword search tool below to find specific information within the annual report.-
 1
1 -
2
-
3
-
4
-
5
-
6
-
7
-
8
-
9
-
10
-
11
-
12
-
13
-
14
-
15
-
16
-
17
-
18
-
19
-
20
-
 21
21 -
 22
22 -
 23
23 -
 24
24 -
 25
25 -
 26
26 -
 27
27 -
 28
28 -
 29
29 -
 30
30 -
 31
31 -
 32
32 -
 33
33 -
 34
34 -
 35
35 -
 36
36 -
 37
37 -
 38
38 -
 39
39 -
 40
40 -
 41
41 -
42
-
43
-
44
-
45
-
46
-
47
-
48
-
49
-
50
-
51
-
52
-
53
-
54
-
55
-
56
-
57
-
58
-
59
-
60
-
61
-
62
-
63
-
64
-
65
-
66
-
67
-
68
-
69
-
70
-
71
-
72
-
73
-
74
-
75
-
76
-
77
-
78
-
79
-
80
-
81
-
82
-
83
-
84
-
85
-
86
-
87
-
88
-
89
-
90
-
91
-
92
-
93
-
94
-
95
-
96
-
97
-
98
-
99
-
100
-
101
-
102
-
103
-
104
-
105
-
106
-
107
-
108
-
109
-
110
-
111
-
112
-
113
-
114
-
115
-
116
-
117
-
118
-
119
-
120
-
121
-
122
-
123
-
124
-
125
-
126
-
127
-
128
-
129
-
130
-
131
-
132
-
133
-
134
-
135
-
136
-
137
-
138
-
139
-
140
-
141
-
142
-
143
-
144
-
145
-
146
-
147
-
148
-
149
-
150
-
151
-
152
-
153
-
154
-
155
-
156
-
157
-
158
-
159
-
160
-
161
-
162
-
163
-
164
-
165
-
166
-
167
-
168
-
169
-
170
-
171
-
172
-
173
-
174
-
175
-
176
-
177
-
178
-
179
-
180
-
181
-
182
-
183
-
184
-
185
-
186
-
187
-
188
-
189
-
190
-
191
-
192
-
193
-
194
-
195
-
196
-
197
-
198
-
199
-
200
-
201
-
202
-
203
-
204
-
205
-
206
-
207
-
208
-
209
-
210
-
211
-
212
-
213
-
214
-
215
-
216
-
217
-
218
-
219
-
220
 |
 |

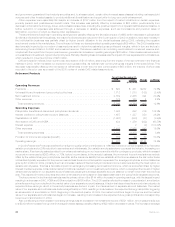
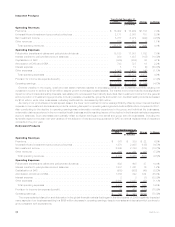
In response to the economic crisis and unusual financial market events that occurred in 2008 and continued into 2009, we decided to
utilize excess debt capacity. The Holding Company completed three debt issuances in 2009. The Holding Company issued $397 million of
floating rate senior notes in March 2009, $1.3 billion of senior notes in May 2009, and $500 million of junior subordinated debt securities in
July 2009. In February 2009, in connection with the initial settlement of the stock purchase contracts issued as part of the common equity
units sold in June 2005, the Holding Company issued common stock for $1.0 billion. The proceeds from these equity and debt issuances
were used for general corporate purposes and have resulted in increased investments and cash and cash equivalents held within Banking,
Corporate & Other.
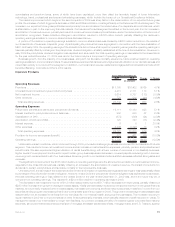
Operating earnings available to common shareholders improved by $114 million, of which $254 million was due to MetLife Bank and its
acquisitions of a residential mortgage origination and servicing business and a reverse mortgage business, both during 2008. Excluding the
impact of MetLife Bank, our operating earnings available to common shareholders decreased $140 million, primarily due to lower net
investment income, partially offset by the impact of a lower effective tax rate. The lower effective tax rate provided an increased benefit of
$139 million from the prior year. This benefit was the result of a partial settlement of certain prior year tax audit issues and increased utilization
of tax preferenced investments, which provide tax credits and deductions.
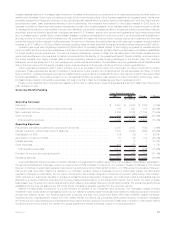
Excluding a $68 million increase from MetLife Bank, net investment income decreased $283 million, which was primarily due a decrease of
$287 million due to lower yields, partially offset by an increase of $4 million due to an increase in average invested assets. Consistent with the
consolidated results of operations discussion above, yields were adversely impacted by the severe downturn in the global financial markets,
which primarily impacted fixed maturity securities and real estate joint ventures. The increased average invested asset base was due to cash
flows from debt issuances during 2009. Our investments primarily include structured finance securities, investment grade corporate fixed
maturity securities, U.S. Treasury, agency and government guaranteed fixed maturity securities and mortgage loans. In addition, our
investment portfolio includes the excess capital not allocated to the segments. Accordingly, it includes a higher allocation to certain other
invested asset classes to provide additional diversification and opportunity for long-term yield enhancement including leveraged leases, other
limited partnership interests, real estate, real estate joint ventures and equity securities.
After excluding the impact of a $394 million increase from MetLife Bank, other expenses increased by $20 million. Deferred compensation
costs, which are tied to equity market performance, were higher due to a significant market rebound. We also had an increase in costs
associated with the implementation of our Operational Excellence initiative. These increases were partially offset by lower postemployment
related costs and corporate-related expenses, specifically legal costs. Legal costs were lower largely due to the prior year commutation of
asbestos policies. In addition, interest expense declined slightly as a result of rate reductions on variable rate collateral financing arrange-
ments offset by debt issuances in 2009 and 2008.
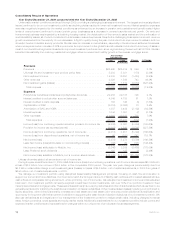
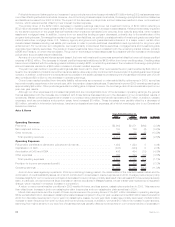
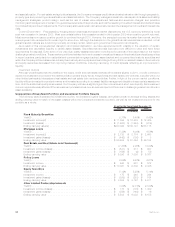
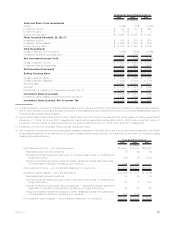
Consolidated Results of Operations
Year Ended December 31, 2008 compared with the Year Ended December 31, 2007
2008 2007 Change % Change
Years Ended December 31,
(In millions)
Revenues
Premiums ................................................... $25,914 $22,970 $2,944 12.8%
Universallifeandinvestment-typeproductpolicyfees....................... 5,381 5,238 143 2.7%
Netinvestmentincome........................................... 16,291 18,057 (1,766) (9.8)%
Otherrevenues................................................ 1,586 1,465 121 8.3%
Netinvestmentgains(losses) ...................................... 1,812 (578) 2,390 413.5%
Totalrevenues............................................... 50,984 47,152 3,832 8.1%
Expenses
Policyholder benefits and claims and policyholder dividends . . . . . . . . . . . . . . . . . . . 29,188 25,506 3,682 14.4%
Interestcreditedtopolicyholderaccountbalances......................... 4,788 5,461 (673) (12.3)%
Interestcreditedtobankdeposits.................................... 166 200 (34) (17.0)%
CapitalizationofDAC............................................ (3,092) (3,064) (28) (0.9)%
AmortizationofDACandVOBA ..................................... 3,489 2,250 1,239 55.1%
Interestexpense............................................... 1,051 897 154 17.2%
Otherexpenses ............................................... 10,333 10,122 211 2.1%
Totalexpenses .............................................. 45,923 41,372 4,551 11.0%
Incomebeforeprovisionforincometax ................................ 5,061 5,780 (719) (12.4)%
Provisionforincometaxexpense(benefit) .............................. 1,580 1,675 (95) (5.7)%
Income(loss)fromcontinuingoperations,netofincometax................... 3,481 4,105 (624) (15.2)%
Income(loss)fromdiscontinuedoperations,netofincometax ................. (203) 360 (563) (156.4)%
Netincome(loss) .............................................. 3,278 4,465 (1,187) (26.6)%
Less:Netincome(loss)attributabletononcontrollinginterests ................. 69 148 (79) (53.4)%
Netincome(loss)attributabletoMetLife,Inc. ............................ 3,209 4,317 (1,108) (25.7)%
Less:Preferredstockdividends..................................... 125 137 (12) (8.8)%
Netincome(loss)availabletoMetLife,Inc.’scommonshareholders.............. $ 3,084 $ 4,180 $(1,096) (26.2)%
25MetLife, Inc.