MetLife 2009 Annual Report Download - page 12
Download and view the complete annual report
Please find page 12 of the 2009 MetLife annual report below. You can navigate through the pages in the report by either clicking on the pages listed below, or by using the keyword search tool below to find specific information within the annual report.-
 1
1 -
 2
2 -
 3
3 -
 4
4 -
 5
5 -
 6
6 -
 7
7 -
 8
8 -
 9
9 -
 10
10 -
 11
11 -
 12
12 -
 13
13 -
 14
14 -
 15
15 -
 16
16 -
 17
17 -
 18
18 -
 19
19 -
 20
20 -
 21
21 -
 22
22 -
23
-
24
-
25
-
26
-
27
-
28
-
29
-
30
-
31
-
32
-
33
-
34
-
35
-
36
-
37
-
38
-
39
-
40
-
41
-
42
-
43
-
44
-
45
-
46
-
47
-
48
-
49
-
50
-
51
-
52
-
53
-
54
-
55
-
56
-
57
-
58
-
59
-
60
-
61
-
62
-
63
-
64
-
65
-
66
-
67
-
68
-
69
-
70
-
71
-
72
-
73
-
74
-
75
-
76
-
77
-
78
-
79
-
80
-
81
-
82
-
83
-
84
-
85
-
86
-
87
-
88
-
89
-
90
-
91
-
92
-
93
-
94
-
95
-
96
-
97
-
98
-
99
-
100
-
101
-
102
-
103
-
104
-
105
-
106
-
107
-
108
-
109
-
110
-
111
-
112
-
113
-
114
-
115
-
116
-
117
-
118
-
119
-
120
-
121
-
122
-
123
-
124
-
125
-
126
-
127
-
128
-
129
-
130
-
131
-
132
-
133
-
134
-
135
-
136
-
137
-
138
-
139
-
140
-
141
-
142
-
143
-
144
-
145
-
146
-
147
-
148
-
149
-
150
-
151
-
152
-
153
-
154
-
155
-
156
-
157
-
158
-
159
-
160
-
161
-
162
-
163
-
164
-
165
-
166
-
167
-
168
-
169
-
170
-
171
-
172
-
173
-
174
-
175
-
176
-
177
-
178
-
179
-
180
-
181
-
182
-
183
-
184
-
185
-
186
-
187
-
188
-
189
-
190
-
191
-
192
-
193
-
194
-
195
-
196
-
197
-
198
-
199
-
200
-
201
-
202
-
203
-
204
-
205
-
206
-
207
-
208
-
209
-
210
-
211
-
212
-
213
-
214
-
215
-
216
-
217
-
218
-
219
-
220
 |
 |

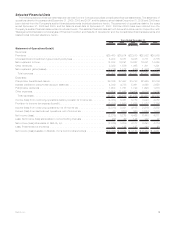
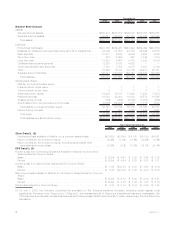
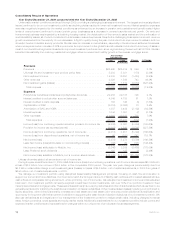
2009 2008 2007
Years Ended December 31,
(In millions)
Income(loss)fromcontinuingoperations,netofincometax .............. $(2,318) $3,481 $4,105
Less:Netinvestmentgains(losses).............................. (7,772) 1,812 (578)
Less:Otheradjustmentstocontinuingoperations..................... 284 (662) (317)
Less:Provisionforincometax(expense)benefit...................... 2,683 (488) 293
Operatingearnings......................................... 2,487 2,819 4,707
Less:Preferredstockdividends ................................ 122 125 137
Operatingearningsavailabletocommonshareholders.................. $2,365 $2,694 $4,570
Year Ended December 31, 2009 compared with the Year Ended December 31, 2008
Unless otherwise stated, all amounts are net of income tax.
During the year ended December 31, 2009, MetLife’s income (loss) from continuing operations, net of income tax, decreased $5.8 billion
to a loss of $2.3 billion from income of $3.5 billion in the comparable 2008 period. The year over year change is predominantly due to a
$5.2 billion unfavorable change in net investment gains (losses) to losses of $4.6 billion, net of related adjustments, in 2009 from gains of
$644 million, net of related adjustments, in 2008. In addition, operating earnings available to common shareholders decreased by $329 million
to $2.4 billion in 2009 from $2.7 billion in 2008.
The unfavorable change in net investment gains (losses) of $5.2 billion, net of related adjustments, was primarily driven by losses on
freestanding derivatives, partially offset by gains on embedded derivatives, primarily associated with variable annuity minimum benefit
guarantees, and lower losses on fixed maturity securities.
The positive impacts of business growth and favorable mortality in several of our businesses were more than offset by a decline in net
investment income, resulting in a decrease in operating earnings of $329 million. The decrease in net investment income caused significant
declines in the operating earnings of many of our businesses, especially the interest spread businesses. Also contributing to the decline in
operating earnings was an increase in net guaranteed annuity benefit costs and a charge related to our closed block of business, a specific
group of participating life policies that were segregated in connection with the demutualization of MLIC. The favorable impact of Operational
Excellence, our enterprise-wide cost reduction and revenue enhancement initiative, was more than offset by higher pension and postre-
tirement benefit costs, driving the increase in other expenses. The declines in operating earnings were partially offset by a change in
amortization related to DAC, deferred sales inducement (“DSI”), and unearned revenue.
Year Ended December 31, 2008 compared with the Year Ended December 31, 2007
Unless otherwise stated, all amounts are net of income tax.
During the year ended December 31, 2008, MetLife’s income (loss) from continuing operations, net of income tax, decreased $624 million
to $3.5 billion from $4.1 billion in the comparable 2007 period. The year over year change was predominantly due to a $1.9 billion decrease in
operating earnings available to common shareholders. Partially offsetting this decline was a $1.1 billion favorable change in net investment
gains (losses) to gains of $644 million, net of related adjustments, in 2008 from losses of $438 million, net of related adjustments, in 2007.
Beginning in the third quarter of 2008, there was unprecedented disruption and dislocation in the global financial markets that caused
extreme volatility in the equity, credit and real estate markets. This adversely impacted both net investment income as yields decreased and
net investment gains (losses) as there was an increase in impairments and credit-related losses.
We responded to the extraordinary market conditions by increasing levels of cash, cash equivalents, short-term investments and high
quality, lower yielding fixed maturity securities particularly in two operating segments: Corporate Benefit Funding and Retirement Products, as
well as in Banking, Corporate & Other. We decreased fixed maturity security holdings to increase our liquidity position.
The favorable change of $1.1 billion in net investment gains (losses), net of related adjustments, was driven by increased gains on
freestanding derivatives, partially offset by increased losses on embedded derivatives primarily associated with variable annuity minimum
benefit guarantees, and increased impairment losses on fixed maturity securities and equity securities.
The unprecedented disruption and dislocation in the global financial markets resulted in decreased yields on our investment portfolio and,
in response to the market conditions, we increased our asset allocation to lower yielding, more liquid investments, both of which contributed
to a decline in net investment income and, consequently, operating earnings available to common shareholders. The market environment’s
negative impact on investment results was partially offset by growth in average invested assets calculated excluding unrealized gains and
losses. In addition, the volatile market environment also resulted in declines in our separate account balances. Such declines required us to
increase DAC amortization, negatively affecting operating earnings available to common shareholders. The declines in the separate account
balances also resulted in lower policy fees and other revenues. Operating earnings available to common shareholders for the year ended
December 31, 2008 were also lower as a result of higher catastrophe losses and unfavorable mortality in various products. Higher earnings
from our dental business and from our businesses in the Latin America and Asia Pacific regions partially offset the aforementioned items.
Consolidated Company Outlook
In 2009, the general economic conditions of the marketplace, particularly in the early part of the year, continued to be volatile and
negatively impacted the results of the Company. In 2010, we expect meaningful earnings recovery for the Company, driven primarily by the
following:
• Continued growth in premiums, fees & other revenues
• We expect top-line growth in 2010 of approximately 6% over 2009. We expect this growth will be driven by:
• Higher fees earned on separate accounts, as the full impact of the recovery in the equity market is felt, thereby increasing the value
of those separate accounts;
• Increased sales in the pension closeout business, both in the United States and the United Kingdom, as the demand for these
products rebounds from the lower levels seen in 2009;
6MetLife, Inc.