MetLife 2009 Annual Report Download - page 201
Download and view the complete annual report
Please find page 201 of the 2009 MetLife annual report below. You can navigate through the pages in the report by either clicking on the pages listed below, or by using the keyword search tool below to find specific information within the annual report.-
 1
1 -
2
-
3
-
4
-
5
-
6
-
7
-
8
-
9
-
10
-
11
-
12
-
13
-
14
-
15
-
16
-
17
-
18
-
19
-
20
-
21
-
22
-
23
-
24
-
25
-
26
-
27
-
28
-
29
-
30
-
31
-
32
-
33
-
34
-
35
-
36
-
37
-
38
-
39
-
40
-
41
-
42
-
43
-
44
-
45
-
46
-
47
-
48
-
49
-
50
-
51
-
52
-
53
-
54
-
55
-
56
-
57
-
58
-
59
-
60
-
61
-
62
-
63
-
64
-
65
-
66
-
67
-
68
-
69
-
70
-
71
-
72
-
73
-
74
-
75
-
76
-
77
-
78
-
79
-
80
-
81
-
82
-
83
-
84
-
85
-
86
-
87
-
88
-
89
-
90
-
91
-
92
-
93
-
94
-
95
-
96
-
97
-
98
-
99
-
100
-
101
-
102
-
103
-
104
-
105
-
106
-
107
-
108
-
109
-
110
-
111
-
112
-
113
-
114
-
115
-
116
-
117
-
118
-
119
-
120
-
121
-
122
-
123
-
124
-
125
-
126
-
127
-
128
-
129
-
130
-
131
-
132
-
133
-
134
-
135
-
136
-
137
-
138
-
139
-
140
-
141
-
142
-
143
-
144
-
145
-
146
-
147
-
148
-
149
-
150
-
151
-
152
-
153
-
154
-
155
-
156
-
157
-
158
-
159
-
160
-
161
-
162
-
163
-
164
-
165
-
166
-
167
-
168
-
169
-
170
-
171
-
172
-
173
-
174
-
175
-
176
-
177
-
178
-
179
-
180
-
181
-
182
-
183
-
184
-
185
-
186
-
187
-
188
-
189
-
190
-
 191
191 -
 192
192 -
 193
193 -
 194
194 -
 195
195 -
 196
196 -
 197
197 -
 198
198 -
 199
199 -
 200
200 -
 201
201 -
 202
202 -
 203
203 -
 204
204 -
 205
205 -
 206
206 -
 207
207 -
 208
208 -
 209
209 -
 210
210 -
 211
211 -
212
-
213
-
214
-
215
-
216
-
217
-
218
-
219
-
220
 |
 |

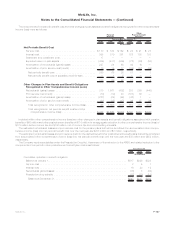
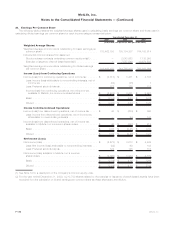
Performance Share amounts above represent aggregate initial target awards and do not reflect potential increases or decreases resulting
from the final performance factor to be determined at the end of the respective performance period. At December 31, 2009, the three year
performance period for the 2007 Performance Share grants was completed. Included in the immediately preceding table are 801,750
outstanding Performance Shares to which the final performance factor will be applied. The calculation of the performance factor is expected
to be finalized during the second quarter of 2010 after all data necessary to perform the calculation is publicly available.
Performance Share awards are accounted for as equity awards but are not credited with dividend-equivalents for actual dividends paid on
the Holding Company’s common stock during the performance period. Accordingly, the estimated fair value of Performance Shares is based
upon the closing price of the Holding Company’s common stock on the date of grant, reduced by the present value of estimated dividends to
be paid on that stock during the performance period.
Compensation expense related to initial Performance Shares granted prior to January 1, 2006 and expected to vest is recognized ratably
during the performance period. Compensation expense related to initial Performance Shares granted on or after January 1, 2006 and
expected to vest is recognized ratably over the performance period or the period to retirement eligibility, if shorter. Performance Shares
expected to vest and the related compensation expenses may be further adjusted by the performance factor most likely to be achieved, as
estimated by management, at the end of the performance period. Compensation expense of $11 million, $70 million and $90 million, related
to Performance Shares was recognized for the years ended December 31, 2009, 2008 and 2007, respectively.
At December 31, 2009, there was $29 million of total unrecognized compensation costs related to Performance Share awards. It is
expected that these costs will be recognized over a weighted average period of 1.52 years.
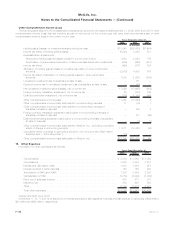
Restricted Stock Units
Beginning in 2005, certain members of management were awarded Restricted Stock Units under (and as defined in) the 2005 Stock Plan.
Restricted Stock Unit awards will normally vest on the third or later anniversary of the date of the award (subject to certain contingencies) and
each unit will be primarily payable entirely in shares of the Holding Company’s common stock.
During the year ended December 31, 2009, the Holding Company granted 295,000 Restricted Stock Units for which the total fair value on
the date of grant was $6 million. The number of Restricted Stock Units outstanding at December 31, 2009 was 393,362 with a weighted
average fair value of $28.05 per unit.
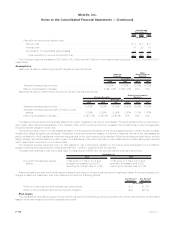
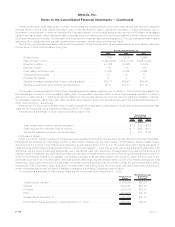
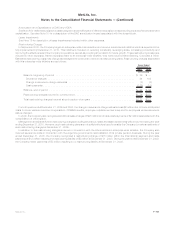
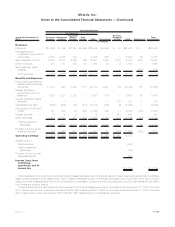
The following is a summary of Restricted Stock Unit activity for the year ended December 31, 2009:
Restricted Stock
Units
Weighted Average
Grant Date
Fair Value
Outstanding at January 1, . . . . . . . . . . . . . . . . . . . . . . . . . . . . . . . . . . . . . . 149,374 $51.46
Granted . . . . . . . . . . . . . . . . . . . . . . . . . . . . . . . . . . . . . . . . . . . . . . . . . . 295,000 $20.83
Forfeited.................................................. (31,850) $57.57
Paid..................................................... (19,162) $50.25
Outstanding at December 31, . . . . . . . . . . . . . . . . . . . . . . . . . . . . . . . . . . . . 393,362 $28.05
Restricted Stock Units expected to vest at December 31, 2009 . . . . . . . . . . . . . . 393,362 $28.05
Compensation expense related to Restricted Stock Units granted on or after January 1, 2006 and expected to vest is recognized ratably
over a three year period or the period to retirement eligibility, if shorter. Compensation expense of $3 million, $2 million and $1 million related to
Restricted Stock Units was recognized for the year ended December 31, 2009, 2008 and 2007 respectively.
At December 31, 2009, there was $5 million of total unrecognized compensation costs related to Restricted Stock Units. It is expected
that these costs will be recognized over a weighted average period of 1.83 years.
Long-Term Performance Compensation Plan
Prior to January 1, 2005, the Holding Company granted stock-based compensation awards to certain members of management under the
Long-Term Performance Compensation Plan (“LTPCP”). The final LTPCP performance period concluded during 2007. The awards for the final
LTPCP performance period, in the amount of 618,375 shares of the Holding Company’s common stock and $16 million in cash, were paid
during 2007. No significant compensation expense related to LTPCP was recognized during the year ended December 31, 2007.
Statutory Equity and Income
Each insurance company’s state of domicile imposes minimum risk-based capital (“RBC”) requirements that were developed by the NAIC.
The formulas for determining the amount of RBC specify various weighting factors that are applied to financial balances or various levels of
activity based on the perceived degree of risk. Regulatory compliance is determined by a ratio of total adjusted capital, as defined by the
NAIC,toauthorizedcontrollevelRBC,asdefinedbytheNAIC.Companiesbelow specific trigger points or ratios are classified within certain
levels, each of which requires specified corrective action. Each of the Holding Company’s U.S. insurance subsidiaries exceeded the
minimum RBC requirements for all periods presented herein.
The NAIC has adopted the Codification of Statutory Accounting Principles (“Statutory Codification”). Statutory Codification is intended to
standardize regulatory accounting and reporting to state insurance departments. However, statutory accounting principles continue to be
established by individual state laws and permitted practices. The New York Insurance Department has adopted Statutory Codification with
certain modifications for the preparation of statutory financial statements of insurance companies domiciled in New York. Modifications by the
various state insurance departments may impact the effect of Statutory Codification on the statutory capital and surplus of the Holding
Company’s insurance subsidiaries.
F-117MetLife, Inc.
MetLife, Inc.
Notes to the Consolidated Financial Statements — (Continued)