MetLife 2009 Annual Report Download - page 192
Download and view the complete annual report
Please find page 192 of the 2009 MetLife annual report below. You can navigate through the pages in the report by either clicking on the pages listed below, or by using the keyword search tool below to find specific information within the annual report.-
 1
1 -
2
-
3
-
4
-
5
-
6
-
7
-
8
-
9
-
10
-
11
-
12
-
13
-
14
-
15
-
16
-
17
-
18
-
19
-
20
-
21
-
22
-
23
-
24
-
25
-
26
-
27
-
28
-
29
-
30
-
31
-
32
-
33
-
34
-
35
-
36
-
37
-
38
-
39
-
40
-
41
-
42
-
43
-
44
-
45
-
46
-
47
-
48
-
49
-
50
-
51
-
52
-
53
-
54
-
55
-
56
-
57
-
58
-
59
-
60
-
61
-
62
-
63
-
64
-
65
-
66
-
67
-
68
-
69
-
70
-
71
-
72
-
73
-
74
-
75
-
76
-
77
-
78
-
79
-
80
-
81
-
82
-
83
-
84
-
85
-
86
-
87
-
88
-
89
-
90
-
91
-
92
-
93
-
94
-
95
-
96
-
97
-
98
-
99
-
100
-
101
-
102
-
103
-
104
-
105
-
106
-
107
-
108
-
109
-
110
-
111
-
112
-
113
-
114
-
115
-
116
-
117
-
118
-
119
-
120
-
121
-
122
-
123
-
124
-
125
-
126
-
127
-
128
-
129
-
130
-
131
-
132
-
133
-
134
-
135
-
136
-
137
-
138
-
139
-
140
-
141
-
142
-
143
-
144
-
145
-
146
-
147
-
148
-
149
-
150
-
151
-
152
-
153
-
154
-
155
-
156
-
157
-
158
-
159
-
160
-
161
-
162
-
163
-
164
-
165
-
166
-
167
-
168
-
169
-
170
-
171
-
172
-
173
-
174
-
175
-
176
-
177
-
178
-
179
-
180
-
181
-
 182
182 -
 183
183 -
 184
184 -
 185
185 -
 186
186 -
 187
187 -
 188
188 -
 189
189 -
 190
190 -
 191
191 -
 192
192 -
 193
193 -
 194
194 -
 195
195 -
 196
196 -
 197
197 -
 198
198 -
 199
199 -
 200
200 -
 201
201 -
 202
202 -
203
-
204
-
205
-
206
-
207
-
208
-
209
-
210
-
211
-
212
-
213
-
214
-
215
-
216
-
217
-
218
-
219
-
220
 |
 |

2009 2008 2007
Years Ended
December 31,
(In millions)
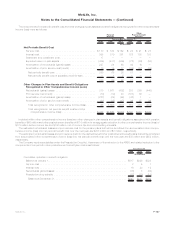
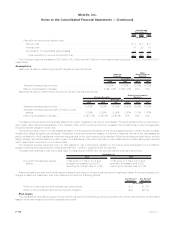
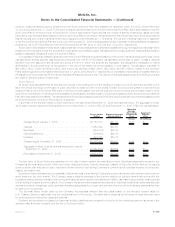
Reduction in net periodic benefit cost:
Servicecost........................................................ $ 3 $ 5 $ 7
Interestcost........................................................ 16 20 19
Amortizationofnetactuarialgains(losses) .................................... 10 — 5
Totalreductioninnetperiodicbenefitcost................................... $29 $25 $31
The Company received subsidies of $12 million, $12 million and $10 million for the years ended December 31, 2009, 2008 and 2007,
respectively.
Assumptions
Assumptions used in determining benefit obligations were as follows:
2009 2008 2009 2008
December 31,
Pension
Benefits
Other
Postretirement
Benefits
Weightedaveragediscountrate ........................... 6.25% 6.60% 6.25% 6.62%
Rateofcompensationincrease............................ 2.0%-7.5% 3.5%-7.5% N/A N/A
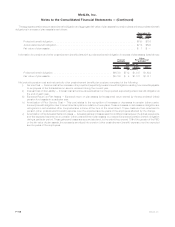
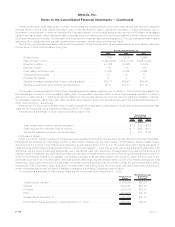
Assumptions used in determining net periodic benefit cost were as follows:
2009 2008 2007 2009 2008 2007
December 31,
Pension Benefits Other Postretirement
Benefits
Weighted average discount rate . . . . . . . . . . . . . . . 6.60% 6.65% 6.00% 6.60% 6.65% 6.00%
Weighted average expected rate of return on plan
assets . . . . . . . . . . . . . . . . . . . . . . . . . . . . . . 8.25% 8.25% 8.25% 7.36% 7.33% 7.47%
Rateofcompensationincrease............... 3.5%-7.5% 3.5%-8% 3.5%-8% N/A N/A N/A
The discount rate is determined annually based on the yield, measured on a yield to worst basis, of a hypothetical portfolio constructed of
high quality debt instruments available on the valuation date, which would provide the necessary future cash flows to pay the aggregate
projected benefit obligation when due.
The expected rate of return on plan assets is based on anticipated performance of the various asset sectors in which the plan invests,
weighted by target allocation percentages. Anticipated future performance is based on long-term historical returns of the plan assets by
sector, adjusted for the Subsidiaries’ long-term expectations on the performance of the markets. While the precise expected return derived
using this approach will fluctuate from year to year, the Subsidiaries’ policy is to hold this long-term assumption constant as long as it remains
within reasonable tolerance from the derived rate.
The weighted average expected return on plan assets for use in that plan’s valuation in 2010 is currently anticipated to be 8.00% for
pension benefits and postretirement medical benefits and 7.20% for postretirement life benefits.
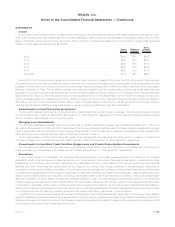
The assumed healthcare cost trend rates used in measuring the APBO and net periodic benefit cost were as follows:
2009 2008
December 31,
Pre-and Post-Medicare eligible
claims....................
8.2% down to 5.8% in 2018 and
gradually decreasing until 2079
reaching the ultimate rate of 4.1%
8.8% down to 5.8% in 2018 and
gradually decreasing until 2079
reaching the ultimate rate of 4.1%
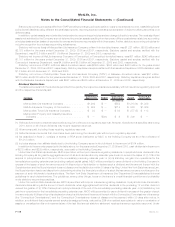
Assumed healthcare cost trend rates may have a significant effect on the amounts reported for healthcare plans. A one-percentage point
change in assumed healthcare cost trend rates would have the following effects:
One Percent
Increase One Percent
Decrease
(In millions)
Effectontotalofserviceandinterestcostcomponents ......................... $ 9 $ (10)
Effect of accumulated postretirement benefit obligation . . . . . . . . . . . . . . . . . . . . . . . . . $94 $(103)
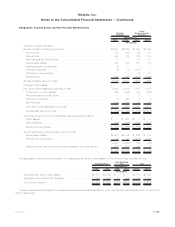
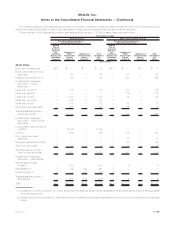
Plan Assets
The Subsidiaries have issued group annuity and life insurance contracts supporting the pension and other postretirement benefit plans
assets, which are invested primarily in separate accounts.
F-108 MetLife, Inc.
MetLife, Inc.
Notes to the Consolidated Financial Statements — (Continued)