MetLife 2009 Annual Report Download - page 44
Download and view the complete annual report
Please find page 44 of the 2009 MetLife annual report below. You can navigate through the pages in the report by either clicking on the pages listed below, or by using the keyword search tool below to find specific information within the annual report.-
 1
1 -
2
-
3
-
4
-
5
-
6
-
7
-
8
-
9
-
10
-
11
-
12
-
13
-
14
-
15
-
16
-
17
-
18
-
19
-
20
-
21
-
22
-
23
-
24
-
25
-
26
-
27
-
28
-
29
-
30
-
31
-
32
-
33
-
 34
34 -
 35
35 -
 36
36 -
 37
37 -
 38
38 -
 39
39 -
 40
40 -
 41
41 -
 42
42 -
 43
43 -
 44
44 -
 45
45 -
 46
46 -
 47
47 -
 48
48 -
 49
49 -
 50
50 -
 51
51 -
 52
52 -
 53
53 -
 54
54 -
55
-
56
-
57
-
58
-
59
-
60
-
61
-
62
-
63
-
64
-
65
-
66
-
67
-
68
-
69
-
70
-
71
-
72
-
73
-
74
-
75
-
76
-
77
-
78
-
79
-
80
-
81
-
82
-
83
-
84
-
85
-
86
-
87
-
88
-
89
-
90
-
91
-
92
-
93
-
94
-
95
-
96
-
97
-
98
-
99
-
100
-
101
-
102
-
103
-
104
-
105
-
106
-
107
-
108
-
109
-
110
-
111
-
112
-
113
-
114
-
115
-
116
-
117
-
118
-
119
-
120
-
121
-
122
-
123
-
124
-
125
-
126
-
127
-
128
-
129
-
130
-
131
-
132
-
133
-
134
-
135
-
136
-
137
-
138
-
139
-
140
-
141
-
142
-
143
-
144
-
145
-
146
-
147
-
148
-
149
-
150
-
151
-
152
-
153
-
154
-
155
-
156
-
157
-
158
-
159
-
160
-
161
-
162
-
163
-
164
-
165
-
166
-
167
-
168
-
169
-
170
-
171
-
172
-
173
-
174
-
175
-
176
-
177
-
178
-
179
-
180
-
181
-
182
-
183
-
184
-
185
-
186
-
187
-
188
-
189
-
190
-
191
-
192
-
193
-
194
-
195
-
196
-
197
-
198
-
199
-
200
-
201
-
202
-
203
-
204
-
205
-
206
-
207
-
208
-
209
-
210
-
211
-
212
-
213
-
214
-
215
-
216
-
217
-
218
-
219
-
220
 |
 |

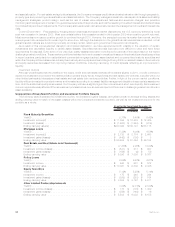
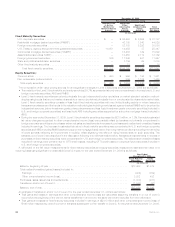
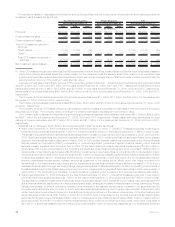
The following tables present the Company’s total fixed maturity securities, based on estimated fair value, by sector classification and by
NRSRO designation and the equivalent ratings of the NAIC, that each designation is comprised of at December 31, 2009 and 2008, with the
exception of non-agency RMBS held by the Company’s domestic insurance subsidiaries at December 31, 2009, which are presented as
described above.
NAIC Rating
Rating Agency Designation Aaa/Aa/A Baa Ba B Caa and
Lower In or Near
Default
Total
Estimated
Fair Value
123456
Fixed Maturity Securities — by Sector & Credit Quality Rating at December 31, 2009
(In millions)
U.S. corporate securities . . . . . . . . . . $ 31,848 $30,266 $ 6,319 $2,965 $ 616 $173 $ 72,187
RMBS . . . . . . . . . . . . . . . . . . . . . . 38,464 1,563 2,260 1,391 339 3 44,020
Foreign corporate securities . . . . . . . . 16,678 17,393 2,067 1,530 281 81 38,030
U.S. Treasury, agency and government
guaranteed securities . . . . . . . . . . . 25,447 — — — — — 25,447
CMBS ...................... 15,000 434 152 22 14 — 15,622
ABS . . . . . . . . . . . . . . . . . . . . . . . . 11,573 1,033 275 124 117 40 13,162
Foreign government securities . . . . . . . 5,786 4,841 890 415 — 15 11,947
State and political subdivision
securities................... 6,337 765 40 8 58 — 7,208
Other fixed maturity securities . . . . . . . 3 10 — 6 — — 19
Total fixed maturity securities . . . . . . $151,136 $56,305 $12,003 $6,461 $1,425 $312 $227,642
Percentage of total . . . . . . . . . . . . . 66.4% 24.7% 5.3% 2.9% 0.6% 0.1% 100.0%
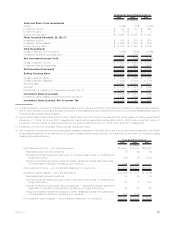
Rating Agency Designation Aaa/Aa/A Baa Ba B Caa and
Lower In or Near
Default
Total
Estimated
Fair Value
NAICRating 1 2 345 6
Fixed Maturity Securities — by Sector & Credit Quality Rating at December 31, 2008
(In millions)
U.S. corporate securities . . . . . . . . . . . $ 31,403 $24,438 $4,891 $2,112 $399 $60 $ 63,303
RMBS . . . . . . . . . . . . . . . . . . . . . . . 34,512 638 695 103 80 — 36,028
Foreign corporate securities . . . . . . . . . 15,936 11,039 1,357 1,184 148 15 29,679
U.S. Treasury, agency and government
guaranteedsecurities............ 21,310 — — — — — 21,310
MBS ........................ 12,486 81 59 7 11 — 12,644
ABS......................... 9,393 1,037 35 16 42 — 10,523
Foreign government securities . . . . . . . . 8,030 1,049 713 357 4 — 10,153
State and political subdivision
securities.................... 4,002 479 46 — 30 — 4,557
Other fixed maturity securities . . . . . . . . 53 — — — 1 — 54
Total fixed maturity securities . . . . . . . $137,125 $38,761 $7,796 $3,779 $715 $75 $188,251
Percentage of total . . . . . . . . . . . . . . 72.9% 20.6% 4.1% 2.0% 0.4% —% 100.0%
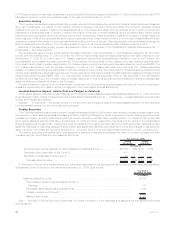
Fixed Maturity and Equity Securities Available-for-Sale. See Note 3 of the Notes to the Consolidated Financial Statements “Invest-
ments — Fixed Maturity and Equity Securities Available-for-Sale” for tables summarizing the cost or amortized cost, gross unrealized gains
and losses, including noncredit loss component of OTTI loss, and estimated fair value of fixed maturity and equity securities on a sector basis,
and selected information about certain fixed maturity securities held by the Company that were below investment grade or non-rated, non-
income producing, credit enhanced by financial guarantor insurers — by sector, and the ratings of the financial guarantor insurers providing
the credit enhancement at December 31, 2009 and 2008.
Concentrations of Credit Risk (Equity Securities). The Company is not exposed to any significant concentrations of credit risk in its equity
securities portfolio of any single issuer greater than 10% of the Company’s stockholders’ equity at December 31, 2009 and 2008.
Concentrations of Credit Risk (Fixed Maturity Securities) — Summary. See Note 3 of the Notes to the Consolidated Financial Statements
“Investments— Fixed Maturity Securities Available-for-Sale Concentrations” for a summary of the concentrations of credit risk related to fixed
maturity securities holdings.
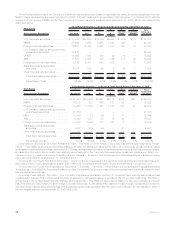
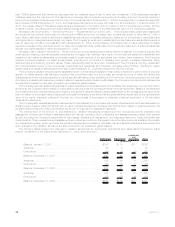
Corporate Fixed Maturity Securities. The Company maintains a diversified portfolio of corporate fixed maturity securities across
industries and issuers. This portfolio does not have an exposure to any single issuer in excess of 1% of the total investments. See Note 3
of the Notes to the Consolidated Financial Statements “Investments — Fixed Maturity Securities Available-for-Sale Concentrations of Credit
Risk (Fixed Maturity Securities) U.S. and Foreign Corporate Securities”for the tables that present the major industry types that comprise the
corporate fixed maturity securities holdings, the largest exposure to a single issuer and the combined holdings in the ten issuers to which it
had the largest exposure at December 31, 2009 and 2008.
38 MetLife, Inc.