MetLife 2009 Annual Report Download - page 39
Download and view the complete annual report
Please find page 39 of the 2009 MetLife annual report below. You can navigate through the pages in the report by either clicking on the pages listed below, or by using the keyword search tool below to find specific information within the annual report.-
 1
1 -
2
-
3
-
4
-
5
-
6
-
7
-
8
-
9
-
10
-
11
-
12
-
13
-
14
-
15
-
16
-
17
-
18
-
19
-
20
-
21
-
22
-
23
-
24
-
25
-
26
-
27
-
28
-
 29
29 -
 30
30 -
 31
31 -
 32
32 -
 33
33 -
 34
34 -
 35
35 -
 36
36 -
 37
37 -
 38
38 -
 39
39 -
 40
40 -
 41
41 -
 42
42 -
 43
43 -
 44
44 -
 45
45 -
 46
46 -
 47
47 -
 48
48 -
 49
49 -
50
-
51
-
52
-
53
-
54
-
55
-
56
-
57
-
58
-
59
-
60
-
61
-
62
-
63
-
64
-
65
-
66
-
67
-
68
-
69
-
70
-
71
-
72
-
73
-
74
-
75
-
76
-
77
-
78
-
79
-
80
-
81
-
82
-
83
-
84
-
85
-
86
-
87
-
88
-
89
-
90
-
91
-
92
-
93
-
94
-
95
-
96
-
97
-
98
-
99
-
100
-
101
-
102
-
103
-
104
-
105
-
106
-
107
-
108
-
109
-
110
-
111
-
112
-
113
-
114
-
115
-
116
-
117
-
118
-
119
-
120
-
121
-
122
-
123
-
124
-
125
-
126
-
127
-
128
-
129
-
130
-
131
-
132
-
133
-
134
-
135
-
136
-
137
-
138
-
139
-
140
-
141
-
142
-
143
-
144
-
145
-
146
-
147
-
148
-
149
-
150
-
151
-
152
-
153
-
154
-
155
-
156
-
157
-
158
-
159
-
160
-
161
-
162
-
163
-
164
-
165
-
166
-
167
-
168
-
169
-
170
-
171
-
172
-
173
-
174
-
175
-
176
-
177
-
178
-
179
-
180
-
181
-
182
-
183
-
184
-
185
-
186
-
187
-
188
-
189
-
190
-
191
-
192
-
193
-
194
-
195
-
196
-
197
-
198
-
199
-
200
-
201
-
202
-
203
-
204
-
205
-
206
-
207
-
208
-
209
-
210
-
211
-
212
-
213
-
214
-
215
-
216
-
217
-
218
-
219
-
220
 |
 |

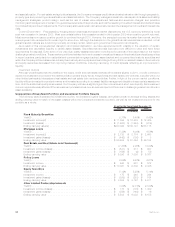
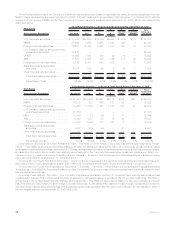
2009 2008 2007
At and for the Years Ended December 31,
(In millions)
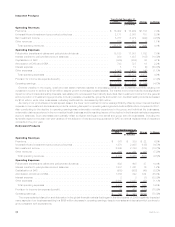
Cash and Short-Term Investments
Yield(1).................................................. 0.44% 1.62% 4.91%
Investmentincome .......................................... $ 94 $ 307 $ 424
Investmentgains ........................................... $ 6 $ 3 $ 3
Endingcarryingvalue ........................................ $ 18,486 $ 38,085 $ 12,505
Other Invested Assets(4), (5), (6), (7)
Investmentincome .......................................... $ 339 $ 279 $ 526
Investmentgains(losses)...................................... $ (4,994) $ 4,363 $ (474)
Endingcarryingvalue ........................................ $ 12,709 $ 17,248 $ 8,076
Total Investments
Grossinvestmentincomeyield(1)................................. 4.90% 5.68% 6.88%
Investmentfeesandexpensesyield............................... (0.14) (0.16) (0.16)
Net Investment Income Yield ................................. 4.76% 5.52% 6.72%
Grossinvestmentincome...................................... $ 15,522 $ 16,660 $ 18,755
Investmentfeesandexpenses .................................. (433) (460) (427)
Net Investment Income(4) ................................... $ 15,089 $ 16,200 $ 18,328
Ending Carrying Value ...................................... $337,679 $322,518 $328,009
Grossinvestmentgains....................................... $ 1,549 $ 2,579 $ 1,386
Grossinvestmentlosses(6)..................................... (1,842) (2,084) (1,710)
Writedowns(6) ............................................. (2,845) (2,042) (140)
Subtotal................................................. $ (3,138) $ (1,547) $ (464)
Derivativesnotqualifyingforhedgeaccounting(4),(6),(7)................. (4,866) 3,422 (380)
Investment Gains (Losses)(4) ................................. $ (8,004) $ 1,875 $ (844)
Investmentgains(losses)incometaxbenefit(provision) .................. 2,876 (733) 280
Investment Gains (Losses), Net of Income Tax..................... $ (5,128) $ 1,142 $ (564)
(1) Yields are based on average of quarterly average asset carrying values, excluding recognized and unrealized investment gains (losses),
and for yield calculation purposes, average of quarterly ending assets exclude collateral received from counterparties associated with the
Company’s securities lending program.
(2) Fixed maturity securities include $2,384 million, $946 million and $779 million at estimated fair value related to trading securities at
December 31, 2009, 2008 and 2007, respectively. Fixed maturity securities include $400 million, ($193) million and $50 million of
investment income related to trading securities for the years ended December 31, 2009, 2008 and 2007, respectively.
(3) Investment income from mortgage loans includes prepayment fees.
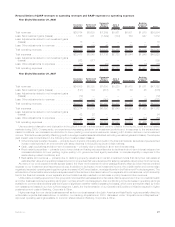
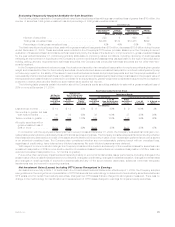
(4) Net investment income and net investment gains (losses) presented in this yield table vary from the amounts presented in the GAAP
consolidated statement of operations due to certain reclassifications made between net investment income and net investment gains
(losses) as presented below.
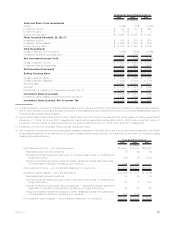
2009 2008 2007
Years Ended December 31,
(In millions)
Netinvestmentincome—peryieldtableabove.......................... $15,089 $16,200 $18,328
Realestatediscontinuedoperations................................ (7) (9) (18)
Scheduled periodic settlement payments on derivative instruments not qualifying for
hedgeaccounting .......................................... (88) (5) (253)
Hedged embedded derivatives related to certain variable annuities with guarantees
ofconsolidatedentitiesandoperatingjointventures .................... (156) 105 —
Net investment income — per consolidated statement of operations . . . . . . . . . . . . . $14,838 $16,291 $18,057
Investmentgains(losses)—peryieldtableabove ........................ $(8,004) $ 1,875 $ (844)
Realestatediscontinuedoperations................................ (8) (8) (13)
Scheduled periodic settlement payments on derivative instruments not qualifying for
hedgeaccounting .......................................... 88 5 253
Interest credited to policyholder account balances — scheduled periodic settlement
payments on derivative instruments not qualifying for hedge accounting . . . . . . . (4) 45 26
Hedged embedded derivatives related to certain variable annuities with guarantees
ofconsolidatedentitiesandoperatingjointventures .................... 156 (105) —
Net investment gains (losses) — per consolidated statement of operations . . . . . . . . $ (7,772) $ 1,812 $ (578)
33MetLife, Inc.