MetLife 2009 Annual Report Download - page 164
Download and view the complete annual report
Please find page 164 of the 2009 MetLife annual report below. You can navigate through the pages in the report by either clicking on the pages listed below, or by using the keyword search tool below to find specific information within the annual report.-
 1
1 -
2
-
3
-
4
-
5
-
6
-
7
-
8
-
9
-
10
-
11
-
12
-
13
-
14
-
15
-
16
-
17
-
18
-
19
-
20
-
21
-
22
-
23
-
24
-
25
-
26
-
27
-
28
-
29
-
30
-
31
-
32
-
33
-
34
-
35
-
36
-
37
-
38
-
39
-
40
-
41
-
42
-
43
-
44
-
45
-
46
-
47
-
48
-
49
-
50
-
51
-
52
-
53
-
54
-
55
-
56
-
57
-
58
-
59
-
60
-
61
-
62
-
63
-
64
-
65
-
66
-
67
-
68
-
69
-
70
-
71
-
72
-
73
-
74
-
75
-
76
-
77
-
78
-
79
-
80
-
81
-
82
-
83
-
84
-
85
-
86
-
87
-
88
-
89
-
90
-
91
-
92
-
93
-
94
-
95
-
96
-
97
-
98
-
99
-
100
-
101
-
102
-
103
-
104
-
105
-
106
-
107
-
108
-
109
-
110
-
111
-
112
-
113
-
114
-
115
-
116
-
117
-
118
-
119
-
120
-
121
-
122
-
123
-
124
-
125
-
126
-
127
-
128
-
129
-
130
-
131
-
132
-
133
-
134
-
135
-
136
-
137
-
138
-
139
-
140
-
141
-
142
-
143
-
144
-
145
-
146
-
147
-
148
-
149
-
150
-
151
-
152
-
153
-
 154
154 -
 155
155 -
 156
156 -
 157
157 -
 158
158 -
 159
159 -
 160
160 -
 161
161 -
 162
162 -
 163
163 -
 164
164 -
 165
165 -
 166
166 -
 167
167 -
 168
168 -
 169
169 -
 170
170 -
 171
171 -
 172
172 -
 173
173 -
 174
174 -
175
-
176
-
177
-
178
-
179
-
180
-
181
-
182
-
183
-
184
-
185
-
186
-
187
-
188
-
189
-
190
-
191
-
192
-
193
-
194
-
195
-
196
-
197
-
198
-
199
-
200
-
201
-
202
-
203
-
204
-
205
-
206
-
207
-
208
-
209
-
210
-
211
-
212
-
213
-
214
-
215
-
216
-
217
-
218
-
219
-
220
 |
 |

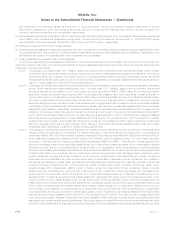
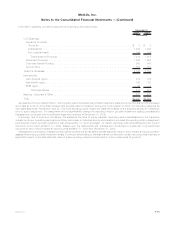
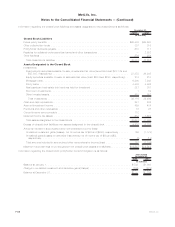
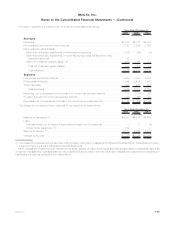
8. Insurance
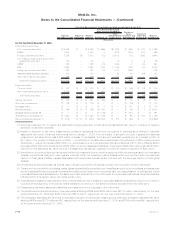
Insurance Liabilities
Insurance liabilities are as follows:
2009 2008 2009 2008 2009 2008
December 31,
Future Policy
Benefits Policyholder Account
Balances Other Policyholder
Funds
(In millions)
U.S. Business:
Insurance Products:
Group life . . . . . . . . . . . . . . . . . . . . $ 2,981 $ 2,984 $ 8,985 $ 8,422 $ 2,411 $ 2,341
Individual life . . . . . . . . . . . . . . . . . . 55,302 54,099 18,632 17,587 2,911 2,876
Non-medical health . . . . . . . . . . . . . . 12,738 11,619 501 501 616 609
Total Insurance Products . . . . . . . . . 71,021 68,702 28,118 26,510 5,938 5,826
Retirement Products . . . . . . . . . . . . . . . 3,978 3,655 46,821 44,282 103 88
Corporate Benefit Funding . . . . . . . . . . . 41,614 40,682 55,556 66,409 216 249
Auto&Home ................... 2,972 3,083 — — 184 43
Total U.S. Business . . . . . . . . . . . 119,585 116,122 130,495 137,201 6,441 6,206
International . . . . . . . . . . . . . . . . . . . . . . 10,830 9,241 8,128 5,654 1,637 1,227
Banking, Corporate & Other . . . . . . . . . . . 5,464 5,192 50 66 368 329
Total . . . . . . . . . . . . . . . . . . . . . $135,879 $130,555 $138,673 $142,921 $ 8,446 $ 7,762
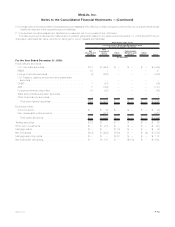
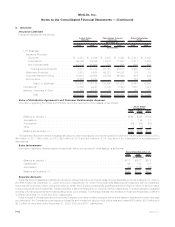
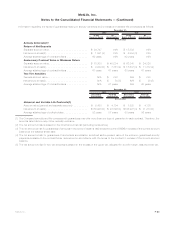
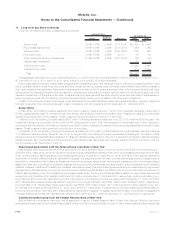
Value of Distribution Agreements and Customer Relationships Acquired
Information regarding the VODA and VOCRA, which are reported in other assets, is as follows:
2009 2008 2007
Years Ended
December 31,
(In millions)
BalanceatJanuary1,................................................. $822 $706 $708
Acquisitions ....................................................... — 144 11
Amortization ....................................................... (34) (25) (16)
Other............................................................ 4 (3) 3
BalanceatDecember31,............................................... $792 $822 $706
The estimated future amortization expense allocated to other expenses for the next five years for VODA and VOCRA is $40 million in 2010,
$44 million in 2011, $49 million in 2012, $52 million in 2013 and $55 million in 2014. See Note 2 for a description of acquisitions and
dispositions.
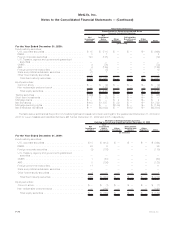
Sales Inducements
Information regarding deferred sales inducements, which are reported in other assets, is as follows:
2009 2008 2007
Years Ended December 31,
(In millions)
BalanceatJanuary1, ............................................... $711 $677 $578
Capitalization..................................................... 193 176 181
Amortization ..................................................... (63) (142) (82)
BalanceatDecember31,............................................. $841 $711 $677
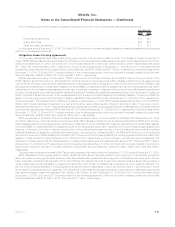
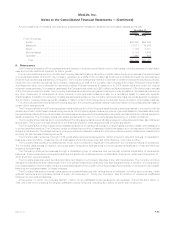
Separate Accounts
Separate account assets and liabilities include two categories of account types: pass-through separate accounts totaling $121.4 billion
and $96.6 billion at December 31, 2009 and 2008, respectively, for which the policyholder assumes all investment risk, and separate
accounts with a minimum return or account value for which the Company contractually guarantees either a minimum return or account value
to the policyholder which totaled $27.6 billion and $24.2 billion at December 31, 2009 and 2008, respectively. The latter category consisted
primarily of funding agreements and participating close-out contracts. The average interest rate credited on these contracts was 3.35% and
4.40% at December 31, 2009 and 2008, respectively.
Fees charged to the separate accounts by the Company (including mortality charges, policy administration fees and surrender charges)
are reflected in the Company’s revenues as universal life and investment-type product policy fees and totaled $2.6 billion, $3.2 billion and
$2.8 billion for the years ended December 31, 2009, 2008 and 2007, respectively.
F-80 MetLife, Inc.
MetLife, Inc.
Notes to the Consolidated Financial Statements — (Continued)