MetLife 2009 Annual Report Download - page 32
Download and view the complete annual report
Please find page 32 of the 2009 MetLife annual report below. You can navigate through the pages in the report by either clicking on the pages listed below, or by using the keyword search tool below to find specific information within the annual report.-
 1
1 -
2
-
3
-
4
-
5
-
6
-
7
-
8
-
9
-
10
-
11
-
12
-
13
-
14
-
15
-
16
-
17
-
18
-
19
-
20
-
21
-
 22
22 -
 23
23 -
 24
24 -
 25
25 -
 26
26 -
 27
27 -
 28
28 -
 29
29 -
 30
30 -
 31
31 -
 32
32 -
 33
33 -
 34
34 -
 35
35 -
 36
36 -
 37
37 -
 38
38 -
 39
39 -
 40
40 -
 41
41 -
 42
42 -
43
-
44
-
45
-
46
-
47
-
48
-
49
-
50
-
51
-
52
-
53
-
54
-
55
-
56
-
57
-
58
-
59
-
60
-
61
-
62
-
63
-
64
-
65
-
66
-
67
-
68
-
69
-
70
-
71
-
72
-
73
-
74
-
75
-
76
-
77
-
78
-
79
-
80
-
81
-
82
-
83
-
84
-
85
-
86
-
87
-
88
-
89
-
90
-
91
-
92
-
93
-
94
-
95
-
96
-
97
-
98
-
99
-
100
-
101
-
102
-
103
-
104
-
105
-
106
-
107
-
108
-
109
-
110
-
111
-
112
-
113
-
114
-
115
-
116
-
117
-
118
-
119
-
120
-
121
-
122
-
123
-
124
-
125
-
126
-
127
-
128
-
129
-
130
-
131
-
132
-
133
-
134
-
135
-
136
-
137
-
138
-
139
-
140
-
141
-
142
-
143
-
144
-
145
-
146
-
147
-
148
-
149
-
150
-
151
-
152
-
153
-
154
-
155
-
156
-
157
-
158
-
159
-
160
-
161
-
162
-
163
-
164
-
165
-
166
-
167
-
168
-
169
-
170
-
171
-
172
-
173
-
174
-
175
-
176
-
177
-
178
-
179
-
180
-
181
-
182
-
183
-
184
-
185
-
186
-
187
-
188
-
189
-
190
-
191
-
192
-
193
-
194
-
195
-
196
-
197
-
198
-
199
-
200
-
201
-
202
-
203
-
204
-
205
-
206
-
207
-
208
-
209
-
210
-
211
-
212
-
213
-
214
-
215
-
216
-
217
-
218
-
219
-
220
 |
 |

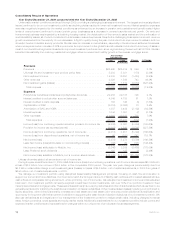
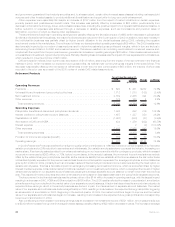
Unless otherwise stated, all amounts are net of income tax.
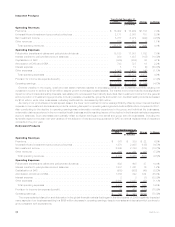
During the year ended December 31, 2008, MetLife’s income (loss) from continuing operations, net of income tax, decreased $624 million
to $3.5 billion from $4.1 billion in the comparable 2007 period. The year over year change was predominantly due to a $1.9 billion decrease in
operating earnings available to common shareholders. Partially offsetting this decline was a $1.1 billion favorable change in net investment
gains (losses) to gains of $644 million, net of related adjustments, in 2008 from losses of $438 million, net of related adjustments, in 2007.
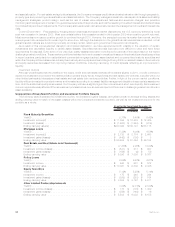
Beginning in the third quarter of 2008, there was unprecedented disruption and dislocation in the global financial markets that caused
extreme volatility in the equity, credit and real estate markets. This adversely impacted net investment income as market yields decreased and
portfolio yields decreased from an increased allocation to lower yielding, more liquid investments. The adverse impact on net investment
gains (losses) from increased impairments and credit-related realized losses was more than offset by favorable market value changes in
derivative instruments.
The increase in net investment gains of $1.1 billion, net of related adjustments, was primarily driven by increased gains on freestanding
derivatives, partially offset by increased losses on embedded derivatives primarily associated with variable annuity minimum benefit
guarantees, and increased impairment losses on fixed maturity securities and equity securities. The increased gains on freestanding
derivatives were from certain interest sensitive derivatives that are economic hedges of certain invested assets and liabilities; gains from
foreign currency derivatives primarily due to the U.S. Dollar strengthening; and gains from equity and interest rate derivatives that are
economic hedges of embedded derivatives. Losses on embedded derivatives increased and were driven by declining interest rates and poor
equity market performance, and were net of gains attributable to a widening in the Company’s own credit spread. The gains on freestanding
derivatives hedging these embedded derivative risks substantially offset the change in the liabilities attributable to market factors, excluding
the adjustment for the change in the Company’s own credit spread, which is not hedged. The increased impairment losses on fixed maturity
and equity securities were primarily associated with financial services industry holdings due to the stress in the global financial markets, as
well as other credit-related impairments due to the lack of intent to hold or uncertainty on intent to hold certain securities until recovery of
market value declines.
Operating earnings available to common shareholders decreased by $1.9 billion to $2.7 billion in 2008 from $4.6 billion in 2007.
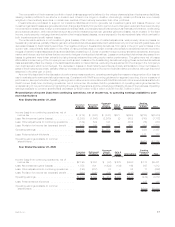
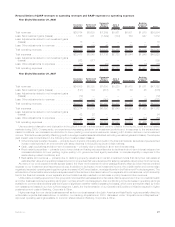
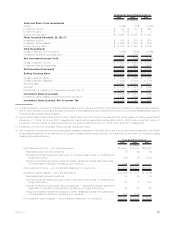
Reconciliation of income (loss) from continuing operations, net of income tax, to operating earnings available to com-
mon shareholders
Year Ended December 31, 2008
Insurance
Products Retirement
Products
Corporate
Benefit
Funding Auto &
Home International
Banking
Corporate
& Other Total
(In millions)
Income (loss) from continuing operations, net of
incometax............................ $2,195 $382 $ (97) $275 $553 $173 $3,481
Less: Net investment gains (losses) . . . . . . . . . . . . . 1,558 901 (1,629) (134) 169 947 1,812
Less: Other adjustments to continuing operations . . . . (193) (612) 74 — 52 17 (662)
Less: Provision for income tax (expense) benefit . . . . . (480) (100) 545 46 (147) (352) (488)
Operatingearnings........................ $1,310 $193 $ 913 $363 $479 (439) 2,819
Less:Preferredstockdividends ............... 125 125
Operating earnings available to common
shareholders . . . . . . . . . . . . . . . . . . . . . . . . . . $(564) $2,694
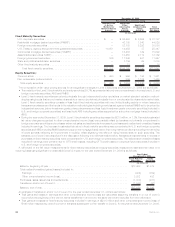
Year Ended December 31, 2007
Insurance
Products Retirement
Products
Corporate
Benefit
Funding Auto &
Home International
Banking
Corporate
& Other Total
(In millions)
Income (loss) from continuing operations, net of
incometax............................ $1,177 $935 $ 675 $436 $621 $261 $4,105
Less:Netinvestmentgains(losses)............. (121) 104 (677) 15 56 45 (578)
Less: Other adjustments to continuing operations . . . . (176) (32) (156) — 32 15 (317)
Less: Provision for income tax (expense) benefit . . . . . 100 (26) 298 (5) (35) (39) 293
Operatingearnings........................ $1,374 $889 $1,210 $426 $568 240 4,707
Less:Preferredstockdividends ............... 137 137
Operating earnings available to common
shareholders .......................... $103 $4,570
26 MetLife, Inc.