MetLife 2009 Annual Report Download - page 121
Download and view the complete annual report
Please find page 121 of the 2009 MetLife annual report below. You can navigate through the pages in the report by either clicking on the pages listed below, or by using the keyword search tool below to find specific information within the annual report.-
 1
1 -
2
-
3
-
4
-
5
-
6
-
7
-
8
-
9
-
10
-
11
-
12
-
13
-
14
-
15
-
16
-
17
-
18
-
19
-
20
-
21
-
22
-
23
-
24
-
25
-
26
-
27
-
28
-
29
-
30
-
31
-
32
-
33
-
34
-
35
-
36
-
37
-
38
-
39
-
40
-
41
-
42
-
43
-
44
-
45
-
46
-
47
-
48
-
49
-
50
-
51
-
52
-
53
-
54
-
55
-
56
-
57
-
58
-
59
-
60
-
61
-
62
-
63
-
64
-
65
-
66
-
67
-
68
-
69
-
70
-
71
-
72
-
73
-
74
-
75
-
76
-
77
-
78
-
79
-
80
-
81
-
82
-
83
-
84
-
85
-
86
-
87
-
88
-
89
-
90
-
91
-
92
-
93
-
94
-
95
-
96
-
97
-
98
-
99
-
100
-
101
-
102
-
103
-
104
-
105
-
106
-
107
-
108
-
109
-
110
-
 111
111 -
 112
112 -
 113
113 -
 114
114 -
 115
115 -
 116
116 -
 117
117 -
 118
118 -
 119
119 -
 120
120 -
 121
121 -
 122
122 -
 123
123 -
 124
124 -
 125
125 -
 126
126 -
 127
127 -
 128
128 -
 129
129 -
 130
130 -
 131
131 -
132
-
133
-
134
-
135
-
136
-
137
-
138
-
139
-
140
-
141
-
142
-
143
-
144
-
145
-
146
-
147
-
148
-
149
-
150
-
151
-
152
-
153
-
154
-
155
-
156
-
157
-
158
-
159
-
160
-
161
-
162
-
163
-
164
-
165
-
166
-
167
-
168
-
169
-
170
-
171
-
172
-
173
-
174
-
175
-
176
-
177
-
178
-
179
-
180
-
181
-
182
-
183
-
184
-
185
-
186
-
187
-
188
-
189
-
190
-
191
-
192
-
193
-
194
-
195
-
196
-
197
-
198
-
199
-
200
-
201
-
202
-
203
-
204
-
205
-
206
-
207
-
208
-
209
-
210
-
211
-
212
-
213
-
214
-
215
-
216
-
217
-
218
-
219
-
220
 |
 |

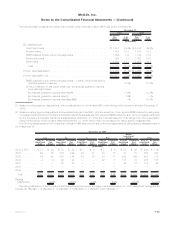
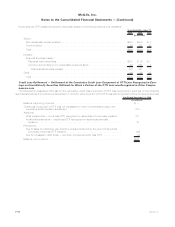
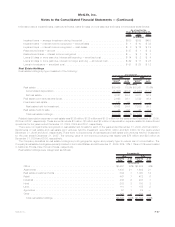
Continuous Gross Unrealized Loss and OTTI Loss for Fixed Maturity and Equity Securities Available-for-Sale by
Sector
The following tables present the estimated fair value and gross unrealized loss of the Company’s fixed maturity and equity securities in an
unrealized loss position, aggregated by sector and by length of time that the securities have been in a continuous unrealized loss position.
The unrealized loss amounts presented below at December 31, 2009 include the noncredit component of OTTI loss. Fixed maturity securities
on which a noncredit OTTI loss has been recognized in accumulated other comprehensive loss are categorized by length of time as being
“less than 12 months” or “equal to or greater than 12 months” in a continuous unrealized loss position based on the point in time that the
estimated fair value initially declined to below the amortized cost basis and not the period of time since the unrealized loss was deemed a
noncredit OTTI loss.
Estimated
Fair
Value
Gross
Unrealized
Loss
Estimated
Fair
Value
Gross
Unrealized
Loss
Estimated
Fair
Value
Gross
Unrealized
Loss
Less than 12 Months Equal to or Greater
than 12 Months Total
December 31, 2009
(In millions, except number of securities)
Fixed Maturity Securities:
U.S. corporate securities . . . . . . . . . . . . . . . . . . . . . . . . . $ 8,641 $ 395 $18,004 $2,314 $26,645 $ 2,709
RMBS...................................... 5,623 119 10,268 2,438 15,891 2,557
Foreign corporate securities . . . . . . . . . . . . . . . . . . . . . . . . 3,786 139 7,282 1,096 11,068 1,235
U.S. Treasury, agency and government guaranteed securities . . 15,051 990 51 20 15,102 1,010
CMBS...................................... 2,052 29 5,435 1,095 7,487 1,124
ABS....................................... 1,259 143 5,875 1,156 7,134 1,299
Foreigngovernmentsecurities ...................... 2,318 55 507 84 2,825 139
State and political subdivision securities . . . . . . . . . . . . . . . . 2,086 94 1,843 317 3,929 411
Otherfixedmaturitysecurities ...................... 6 2 — — 6 2
Total fixed maturity securities . . . . . . . . . . . . . . . . . . . . . . $40,822 $1,966 $49,265 $8,520 $90,087 $10,486
Equity Securities:
Commonstock................................ 56 7 14 1 70 8
Non-redeemable preferred stock . . . . . . . . . . . . . . . . . . . . 66 41 930 226 996 267
Totalequitysecurities .......................... $ 122 $ 48 $ 944 $ 227 $ 1,066 $ 275
Total number of securities in an unrealized loss position . . . . . . 2,210 3,333
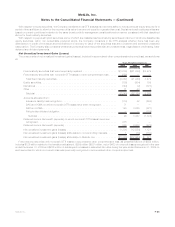
Estimated
Fair
Value
Gross
Unrealized
Loss
Estimated
Fair
Value
Gross
Unrealized
Loss
Estimated
Fair
Value
Gross
Unrealized
Loss
Less than 12 Months Equal to or Greater
than 12 Months Total
December 31, 2008
(In millions, except number of securities)
Fixed Maturity Securities:
U.S.corporatesecurities......................... $30,076 $ 4,479 $18,011 $ 5,423 $ 48,087 $ 9,902
RMBS ..................................... 10,032 2,711 4,572 2,009 14,604 4,720
Foreign corporate securities . . . . . . . . . . . . . . . . . . . . . . . 15,634 3,157 6,609 2,527 22,243 5,684
U.S. Treasury, agency and government guaranteed
securities.................................. 106 1 — — 106 1
CMBS..................................... 9,259 1,665 3,093 1,788 12,352 3,453
ABS ...................................... 6,412 1,325 3,777 2,414 10,189 3,739
Foreigngovernmentsecurities ..................... 2,030 316 403 61 2,433 377
State and political subdivision securities . . . . . . . . . . . . . . . 2,035 405 948 537 2,983 942
Otherfixedmaturitysecurities...................... 20 3 2 — 22 3
Total fixed maturity securities . . . . . . . . . . . . . . . . . . . . . $75,604 $14,062 $37,415 $14,759 $113,019 $28,821
Equity securities ............................. $ 727 $ 306 $ 978 $ 672 $ 1,705 $ 978
Total number of securities in an unrealized loss position . . . . . 9,066 3,539
F-37MetLife, Inc.
MetLife, Inc.
Notes to the Consolidated Financial Statements — (Continued)