MetLife 2009 Annual Report Download - page 68
Download and view the complete annual report
Please find page 68 of the 2009 MetLife annual report below. You can navigate through the pages in the report by either clicking on the pages listed below, or by using the keyword search tool below to find specific information within the annual report.-
 1
1 -
2
-
3
-
4
-
5
-
6
-
7
-
8
-
9
-
10
-
11
-
12
-
13
-
14
-
15
-
16
-
17
-
18
-
19
-
20
-
21
-
22
-
23
-
24
-
25
-
26
-
27
-
28
-
29
-
30
-
31
-
32
-
33
-
34
-
35
-
36
-
37
-
38
-
39
-
40
-
41
-
42
-
43
-
44
-
45
-
46
-
47
-
48
-
49
-
50
-
51
-
52
-
53
-
54
-
55
-
56
-
57
-
 58
58 -
 59
59 -
 60
60 -
 61
61 -
 62
62 -
 63
63 -
 64
64 -
 65
65 -
 66
66 -
 67
67 -
 68
68 -
 69
69 -
 70
70 -
 71
71 -
 72
72 -
 73
73 -
 74
74 -
 75
75 -
 76
76 -
 77
77 -
 78
78 -
79
-
80
-
81
-
82
-
83
-
84
-
85
-
86
-
87
-
88
-
89
-
90
-
91
-
92
-
93
-
94
-
95
-
96
-
97
-
98
-
99
-
100
-
101
-
102
-
103
-
104
-
105
-
106
-
107
-
108
-
109
-
110
-
111
-
112
-
113
-
114
-
115
-
116
-
117
-
118
-
119
-
120
-
121
-
122
-
123
-
124
-
125
-
126
-
127
-
128
-
129
-
130
-
131
-
132
-
133
-
134
-
135
-
136
-
137
-
138
-
139
-
140
-
141
-
142
-
143
-
144
-
145
-
146
-
147
-
148
-
149
-
150
-
151
-
152
-
153
-
154
-
155
-
156
-
157
-
158
-
159
-
160
-
161
-
162
-
163
-
164
-
165
-
166
-
167
-
168
-
169
-
170
-
171
-
172
-
173
-
174
-
175
-
176
-
177
-
178
-
179
-
180
-
181
-
182
-
183
-
184
-
185
-
186
-
187
-
188
-
189
-
190
-
191
-
192
-
193
-
194
-
195
-
196
-
197
-
198
-
199
-
200
-
201
-
202
-
203
-
204
-
205
-
206
-
207
-
208
-
209
-
210
-
211
-
212
-
213
-
214
-
215
-
216
-
217
-
218
-
219
-
220
 |
 |
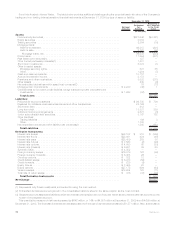
Amounts presented in the table above represent the estimated cash payments to be made to policyholders undiscounted as to interest
and including assumptions related to the receipt of future premiums and deposits; withdrawals, including unscheduled or partial withdrawals;
policy lapses; surrender charges; annuitization; mortality; future interest credited; policy loans and other contingent events as appropriate to
the respective product type. Such estimated cash payments are also presented net of estimated future premiums on policies currently in-
force and gross of any reinsurance recoverable. For obligations denominated in foreign currencies, cash payments have been estimated
using current spot rates.
The sum of the estimated cash flows shown for all years in the table of $198.1 billion exceeds the liability amount of $138.7 billion included
on the consolidated balance sheet principally due to the time value of money, which accounts for at least 80% of the difference, as well as
differences in assumptions between the date the liabilities were initially established and the current date. See the comments under “— Future
policyholder benefits” above regarding the source and uncertainties associated with the estimation of the contractual obligations related to
future policyholder benefits and policyholder account balances.
Other policyholder liabilities — Other policyholder liabilities are comprised of other policyholder funds, policyholder dividends payable and
the policyholder dividend obligation. Amounts included in the table above related to these liabilities are as follows:
a. Other policyholder funds includes liabilities for incurred but not reported claims and claims payable on group term life, long-term
disability, LTC and dental; policyholder dividends left on deposit and policyholder dividends due and unpaid related primarily to
traditional life and group life and health; and premiums received in advance. Liabilities related to unearned revenue of $2.1 billion have
been excluded from the cash payments presented in the table above because they reflect an accounting convention and not a
contractual obligation. With the exception of policyholder dividends left on deposit, and those items excluded as noted in the preceding
sentence, the contractual obligation presented in the table above related to other policyholder funds is equal to the liability reflected in
the consolidated balance sheet. Such amounts are reported in the less than one year category due to the short-term nature of the
liabilities. Contractual obligations on policyholder dividends left on deposit are projected based on assumptions of policyholder
withdrawal activity.
b. Policyholder dividends payable consists of liabilities related to dividends payable in the following calendar year on participating
policies. As such, the contractual obligation related to policyholder dividends payable is presented in the table above in the less than
one year category at the amount of the liability presented in the consolidated balance sheets.
c. The nature of the policyholder dividend obligation is described in Note 10 of the Notes to the Consolidated Financial Statements.
Because the exact timing and amount of the ultimate policyholder dividend obligation is subject to significant uncertainty and the
amount of the policyholder dividend obligation is based upon a long-term projection of the performance of the closed block, we have
reflected the obligation at the amount of the liability, if any, presented in the consolidated balance sheet in the more than five years
category. This was presented to reflect the long-duration of the liability and the uncertainty of the ultimate cash payment.
Bank deposits — Bank deposits of $10.4 billion exceed the amount on the balance sheet of $10.2 billion due to the inclusion of estimated
interest payments. Liquid deposits, including demand deposit accounts, money market accounts and savings accounts, are assumed to
mature at carrying value within one year. Certificates of deposit are assumed to pay all interest and principal at maturity.
Short-term debt, long-term debt, collateral financing arrangements and junior subordinated debt securities — Amounts presented in the
table above for short-term debt, long-term debt, collateral financing arrangements and junior subordinated debt securities differ from the
balances presented on the consolidated balance sheet as the amounts presented in the table above do not include premiums or discounts
upon issuance or purchase accounting fair value adjustments. The amounts presented above also include interest on such obligations as
described below.
Short-term debt consists of borrowings with original maturities of less than one year carrying fixed interest rates. The contractual obligation
for short-term debt presented in the table above represents the amounts due upon maturity plus the related interest for the period from
January 1, 2010 through maturity.
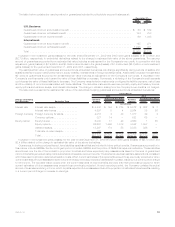
Long-term debt bears interest at fixed and variable interest rates through their respective maturity dates. Interest on fixed rate debt was
computed using the stated rate on the obligations through maturity. Interest on variable rate debt was computed using prevailing rates at
December 31, 2009 and, as such, does not consider the impact of future rate movements. Long-term debt also includes payments under
capital lease obligations of $4 million, $3 million, $0 and $28 million, in the less than one year, one to three years, three to five years and more
than five years categories, respectively.
Collateral financing arrangements bear interest at fixed and variable interest rates through their respective maturity dates. Interest on fixed
rate debt was computed using the stated rate on the obligations through maturity. Interest on variable rate debt was computed using prevailing
rates at December 31, 2009 and, as such, does not consider the impact of future rate movements. Pursuant to these collateral financing
arrangements, the Holding Company may be required to deliver cash or pledge collateral to the respective unaffiliated financial institutions.
See “— The Company — Liquidity and Capital Sources — Collateral Financing Arrangements.”
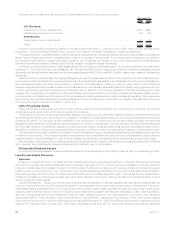
Junior subordinated debt securities bear interest at fixed interest rates through their respective redemption dates. Interest was computed
using the stated rates on the obligations through the scheduled redemption dates as it is the Company’s expectation that the debt will be
redeemed at that time. Inclusion of interest payments on junior subordinated debt through the final maturity dates would increase the
contractual obligation by $4.1 billion.
Payables for collateral under securities loaned and other transactions — The Company has accepted cash collateral in connection with
securities lending and derivative transactions. As the securities lending transactions expire within the next year or the timing of the return of the
collateral is uncertain, the return of the collateral has been included in the less than one year category in the table above. The Company also
holds non-cash collateral, which is not reflected as a liability in the consolidated balance sheet, of $227 million at December 31, 2009.
Commitments to lend funds — The Company commits to lend funds under mortgage loans, partnerships, bank credit facilities, bridge
loans and private corporate bond investments. In the table above, the timing of the funding of mortgage loans and private corporate bond
investments is based on the expiration date of the commitment. As it relates to commitments to lend funds to partnerships and under bank
credit facilities, the Company anticipates that these amounts could be invested any time over the next five years; however, as the timing of the
fulfillment of the obligation cannot be predicted, such obligations are presented in the less than one year category in the table above.
Commitments to fund bridge loans are short-term obligations and, as a result, are presented in the less than one year category in the table
above. See “— Off-Balance Sheet Arrangements.”
62 MetLife, Inc.