MetLife 2009 Annual Report Download - page 190
Download and view the complete annual report
Please find page 190 of the 2009 MetLife annual report below. You can navigate through the pages in the report by either clicking on the pages listed below, or by using the keyword search tool below to find specific information within the annual report.-
 1
1 -
2
-
3
-
4
-
5
-
6
-
7
-
8
-
9
-
10
-
11
-
12
-
13
-
14
-
15
-
16
-
17
-
18
-
19
-
20
-
21
-
22
-
23
-
24
-
25
-
26
-
27
-
28
-
29
-
30
-
31
-
32
-
33
-
34
-
35
-
36
-
37
-
38
-
39
-
40
-
41
-
42
-
43
-
44
-
45
-
46
-
47
-
48
-
49
-
50
-
51
-
52
-
53
-
54
-
55
-
56
-
57
-
58
-
59
-
60
-
61
-
62
-
63
-
64
-
65
-
66
-
67
-
68
-
69
-
70
-
71
-
72
-
73
-
74
-
75
-
76
-
77
-
78
-
79
-
80
-
81
-
82
-
83
-
84
-
85
-
86
-
87
-
88
-
89
-
90
-
91
-
92
-
93
-
94
-
95
-
96
-
97
-
98
-
99
-
100
-
101
-
102
-
103
-
104
-
105
-
106
-
107
-
108
-
109
-
110
-
111
-
112
-
113
-
114
-
115
-
116
-
117
-
118
-
119
-
120
-
121
-
122
-
123
-
124
-
125
-
126
-
127
-
128
-
129
-
130
-
131
-
132
-
133
-
134
-
135
-
136
-
137
-
138
-
139
-
140
-
141
-
142
-
143
-
144
-
145
-
146
-
147
-
148
-
149
-
150
-
151
-
152
-
153
-
154
-
155
-
156
-
157
-
158
-
159
-
160
-
161
-
162
-
163
-
164
-
165
-
166
-
167
-
168
-
169
-
170
-
171
-
172
-
173
-
174
-
175
-
176
-
177
-
178
-
179
-
 180
180 -
 181
181 -
 182
182 -
 183
183 -
 184
184 -
 185
185 -
 186
186 -
 187
187 -
 188
188 -
 189
189 -
 190
190 -
 191
191 -
 192
192 -
 193
193 -
 194
194 -
 195
195 -
 196
196 -
 197
197 -
 198
198 -
 199
199 -
 200
200 -
201
-
202
-
203
-
204
-
205
-
206
-
207
-
208
-
209
-
210
-
211
-
212
-
213
-
214
-
215
-
216
-
217
-
218
-
219
-
220
 |
 |

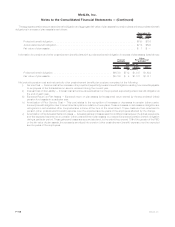
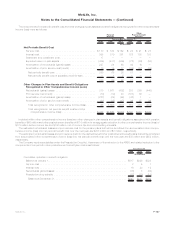
The aggregate pension accumulated benefit obligation and aggregate fair value of plan assets for pension plans with accumulated benefit
obligationsinexcessofplanassetsisasfollows:
2009 2008
December 31,
(In millions)
Projectedbenefitobligation................................................... $798 $708
Accumulatedbenefitobligation................................................. $714 $590
Fairvalueofplanassets..................................................... $ 1 $ —
Information for pension and other postretirement benefit plans with a projected benefit obligation in excess of plan assets is as follows:
2009 2008 2009 2008
December 31,
Pension
Benefits
Other
Postretirement
Benefits
(In millions)
Projectedbenefitobligation .................................... $6,580 $712 $1,847 $1,632
Fairvalueofplanassets ...................................... $5,700 $ 4 $1,121 $1,011
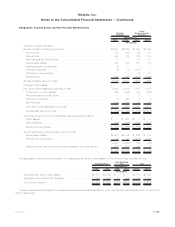
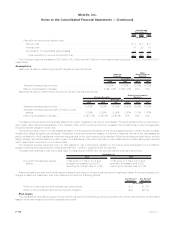
Net periodic pension cost and net periodic other postretirement benefit plan cost are comprised of the following:
i) Service Cost — Service cost is the increase in the projected (expected) pension benefit obligation resulting from benefits payable
to employees of the Subsidiaries on service rendered during the current year.
ii) Interest Cost on the Liability — Interest cost is the time value adjustment on the projected (expected) pension benefit obligation at
the end of each year.
iii) Expected Return on Plan Assets — Expected return on plan assets is the assumed return earned by the accumulated (other)
pension fund assets in a particular year.
iv) Amortization of Prior Service Cost — This cost relates to the recognition of increases or decreases in pension (other postre-
tirement) benefit obligation due to amendments in plans or initiation of new plans. These increases or decreases in obligation are
recognized in accumulated other comprehensive income at the time of the amendment. These costs are then amortized to
pension (other postretirement benefit) expense over the expected service years of the employees affected by the change.
v) Amortization of Net Actuarial Gains or Losses — Actuarial gains and losses result from differences between the actual experience
and the expected experience on pension (other postretirement) plan assets or projected (expected) pension benefit obligation
during a particular period. These gains and losses are accumulated and, to the extent they exceed 10% of the greater of the PBO
or the fair value of plan assets, the excess is amortized into pension (other postretirement benefit) expense over the expected
service years of the employees.
F-106 MetLife, Inc.
MetLife, Inc.
Notes to the Consolidated Financial Statements — (Continued)