MetLife 2009 Annual Report Download - page 53
Download and view the complete annual report
Please find page 53 of the 2009 MetLife annual report below. You can navigate through the pages in the report by either clicking on the pages listed below, or by using the keyword search tool below to find specific information within the annual report.-
 1
1 -
2
-
3
-
4
-
5
-
6
-
7
-
8
-
9
-
10
-
11
-
12
-
13
-
14
-
15
-
16
-
17
-
18
-
19
-
20
-
21
-
22
-
23
-
24
-
25
-
26
-
27
-
28
-
29
-
30
-
31
-
32
-
33
-
34
-
35
-
36
-
37
-
38
-
39
-
40
-
41
-
42
-
 43
43 -
 44
44 -
 45
45 -
 46
46 -
 47
47 -
 48
48 -
 49
49 -
 50
50 -
 51
51 -
 52
52 -
 53
53 -
 54
54 -
 55
55 -
 56
56 -
 57
57 -
 58
58 -
 59
59 -
 60
60 -
 61
61 -
 62
62 -
 63
63 -
64
-
65
-
66
-
67
-
68
-
69
-
70
-
71
-
72
-
73
-
74
-
75
-
76
-
77
-
78
-
79
-
80
-
81
-
82
-
83
-
84
-
85
-
86
-
87
-
88
-
89
-
90
-
91
-
92
-
93
-
94
-
95
-
96
-
97
-
98
-
99
-
100
-
101
-
102
-
103
-
104
-
105
-
106
-
107
-
108
-
109
-
110
-
111
-
112
-
113
-
114
-
115
-
116
-
117
-
118
-
119
-
120
-
121
-
122
-
123
-
124
-
125
-
126
-
127
-
128
-
129
-
130
-
131
-
132
-
133
-
134
-
135
-
136
-
137
-
138
-
139
-
140
-
141
-
142
-
143
-
144
-
145
-
146
-
147
-
148
-
149
-
150
-
151
-
152
-
153
-
154
-
155
-
156
-
157
-
158
-
159
-
160
-
161
-
162
-
163
-
164
-
165
-
166
-
167
-
168
-
169
-
170
-
171
-
172
-
173
-
174
-
175
-
176
-
177
-
178
-
179
-
180
-
181
-
182
-
183
-
184
-
185
-
186
-
187
-
188
-
189
-
190
-
191
-
192
-
193
-
194
-
195
-
196
-
197
-
198
-
199
-
200
-
201
-
202
-
203
-
204
-
205
-
206
-
207
-
208
-
209
-
210
-
211
-
212
-
213
-
214
-
215
-
216
-
217
-
218
-
219
-
220
 |
 |

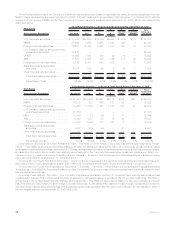
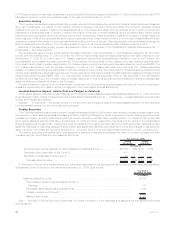
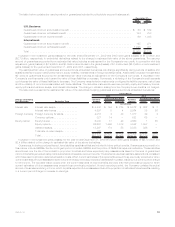
The following table presents the Company’s valuation allowances for loans by type of credit loss at:
2009 2008
December 31,
(In millions)
Specificcreditlosses....................................................... $123 $ 69
Non-specificallyidentifiedcreditlosses ........................................... 598 235
Totalvaluationallowances.................................................... $721 $304
The Company held $210 million and $220 million in mortgage loans which are carried at estimated fair value based on the value of the
underlying collateral or independent broker quotations, if lower, of which $202 million and $188 million relate to impaired mortgage loans
held-for-investment and $8 million and $32 million to certain mortgage loans held-for-sale, at December 31, 2009 and 2008, respectively.
These impaired mortgage loans were recorded at estimated fair value and represent a nonrecurring fair value measurement. The estimated fair
value is categorized as Level 3. Included within net investment gains (losses) for such impaired mortgage loans were net impairments of
$93 million and $79 million for the years ended December 31, 2009 and 2008, respectively.
SeeNote3oftheNotestotheConsolidatedFinancialStatements“Investments — Mortgage Loans” for certain information about impaired
loans, restructured loans, loans 90 days past or more past due, and loans in foreclosure at and for the years ended December 31, 2009, 2008
and 2007.
Real Estate Holdings
The Company’s real estate holdings consist of commercial properties located primarily in the United States. The carrying value of the
Company’s real estate, real estate joint ventures and real estate held-for-sale was $6.9 billion and $7.6 billion, or 2.0% and 2.4%,
respectively, of total cash and invested assets at December 31, 2009 and 2008, respectively.
SeeNote3oftheNotestotheConsolidatedFinancialStatements“Investments— Real Estate Holdings” for a table that presents the
carrying value of the Company’s real estate holdings by type at December 31, 2009 and 2008.
The Company diversifies its real estate holdings by both geographic region and property type to reduce risk of concentration. The
Company’s real estate holdings are primarily located in the United States. The Company’s real estate holdings located in California, Florida,
New York and Texas were 23%, 13%, 11% and 10% at December 31, 2009. See Note 3 of the Notes to the Consolidated Financial Statements
“Investments— Real Estate Holdings” for a table that presents the property type diversification at December 31, 2009 and 2008.
There were no impairments on real estate held-for-sale for the years ended December 31, 2009, 2008 and 2007, respectively. The
Company’s carrying value of real estate held-for-sale at both December 31, 2009 and 2008 has been reduced by impairments recorded prior
to 2007 of $1 million. Impairments of real estate and real estate joint ventures held-for-investment were $160 million and $20 million for the
years ended December 31, 2009 and 2008, respectively. There were no impairments of real estate and real estate joint ventures
held-for-investment for the year ended December 31, 2007. The Company held $93 million in cost basis real estate joint ventures which
were impaired based on the underlying real estate joint venture financial statements at December 31, 2009. These real estate joint ventures
were recorded at estimated fair value and represent a non-recurring fair value measurement. The estimated fair value was categorized as
Level 3. Impairments to estimated fair value for such real estate joint ventures of $83 million for the year ended December 31, 2009, were
recognized within net investment gains (losses) and are included in the $160 million of impairments on real estate and real estate joint ventures
for the year ended December 31, 2009.
Other Limited Partnership Interests
The carrying value of other limited partnership interests (which primarily represent ownership interests in pooled investment funds that
principally make private equity investments in companies in the United States and overseas) was $5.5 billion and $6.0 billion, or 1.6% and
1.9% of total cash and invested assets at December 31, 2009 and 2008, respectively. Included within other limited partnership interests were
$1.0 billion and $1.3 billion, at December 31, 2009 and 2008 respectively, of investments in hedge funds.
The Company held $561 million and $137 million of impaired other limited partnership interests which are accounted for using the cost
basis at December 31, 2009 and 2008, respectively. Impairments on cost basis limited partnership interests are recognized at estimated fair
value determined from information provided in the financial statements of the underlying other limited partnership interests in the period in
which the impairment is recognized. Consistent with equity securities, greater weight and consideration is given in the other limited
partnership interests impairment review process, to the severity and duration of unrealized losses on such other limited partnership interests
holdings. Impairments to estimated fair value for such other limited partnership interests of $354 million, $105 million and $4 million for the
years ended December 31, 2009, 2008 and 2007, respectively, were recognized within net investment gains (losses). These impairments to
estimated fair value represent non-recurring fair value measurements that have been classified as Level 3 due to the limited activity and price
transparency inherent in the market for such investments.
Other Invested Assets
The carrying value of other invested assets was $12.7 billion and $17.2 billion, or 3.8% and 5.3% of total cash and invested assets at
December 31, 2009 and 2008, respectively. See Note 3 of the Notes to the Consolidated Financial Statements “Investments — Other
Invested Assets” for a table that presents the carrying value of the Company’s other invested assets by type at December 31, 2009 and 2008,
and related supporting tables for leveraged leases and MSRs included within other invested assets.
Short-term Investments
The carrying value of short-term investments, which include investments with remaining maturities of one year or less, but greater than
three months, at the time of acquisition was $8.4 billion and $13.9 billion, or 2.5% and 4.3% of total cash and invested assets at December 31,
2009 and 2008, respectively.
Variable Interest Entities
See Note 3 of the Notes to the Consolidated Financial Statements for the information concerning variable interest entities.
47MetLife, Inc.