MetLife 2009 Annual Report Download - page 87
Download and view the complete annual report
Please find page 87 of the 2009 MetLife annual report below. You can navigate through the pages in the report by either clicking on the pages listed below, or by using the keyword search tool below to find specific information within the annual report.-
 1
1 -
2
-
3
-
4
-
5
-
6
-
7
-
8
-
9
-
10
-
11
-
12
-
13
-
14
-
15
-
16
-
17
-
18
-
19
-
20
-
21
-
22
-
23
-
24
-
25
-
26
-
27
-
28
-
29
-
30
-
31
-
32
-
33
-
34
-
35
-
36
-
37
-
38
-
39
-
40
-
41
-
42
-
43
-
44
-
45
-
46
-
47
-
48
-
49
-
50
-
51
-
52
-
53
-
54
-
55
-
56
-
57
-
58
-
59
-
60
-
61
-
62
-
63
-
64
-
65
-
66
-
67
-
68
-
69
-
70
-
71
-
72
-
73
-
74
-
75
-
76
-
 77
77 -
 78
78 -
 79
79 -
 80
80 -
 81
81 -
 82
82 -
 83
83 -
 84
84 -
 85
85 -
 86
86 -
 87
87 -
 88
88 -
 89
89 -
 90
90 -
 91
91 -
 92
92 -
 93
93 -
 94
94 -
 95
95 -
 96
96 -
 97
97 -
98
-
99
-
100
-
101
-
102
-
103
-
104
-
105
-
106
-
107
-
108
-
109
-
110
-
111
-
112
-
113
-
114
-
115
-
116
-
117
-
118
-
119
-
120
-
121
-
122
-
123
-
124
-
125
-
126
-
127
-
128
-
129
-
130
-
131
-
132
-
133
-
134
-
135
-
136
-
137
-
138
-
139
-
140
-
141
-
142
-
143
-
144
-
145
-
146
-
147
-
148
-
149
-
150
-
151
-
152
-
153
-
154
-
155
-
156
-
157
-
158
-
159
-
160
-
161
-
162
-
163
-
164
-
165
-
166
-
167
-
168
-
169
-
170
-
171
-
172
-
173
-
174
-
175
-
176
-
177
-
178
-
179
-
180
-
181
-
182
-
183
-
184
-
185
-
186
-
187
-
188
-
189
-
190
-
191
-
192
-
193
-
194
-
195
-
196
-
197
-
198
-
199
-
200
-
201
-
202
-
203
-
204
-
205
-
206
-
207
-
208
-
209
-
210
-
211
-
212
-
213
-
214
-
215
-
216
-
217
-
218
-
219
-
220
 |
 |

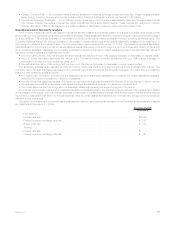
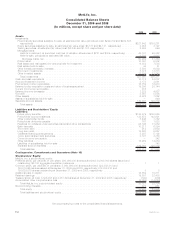
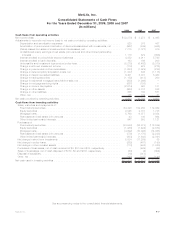
MetLife, Inc.
Consolidated Statements of Operations
For the Years Ended December 31, 2009, 2008 and 2007
(In millions, except per share data)
2009 2008 2007
Revenues
Premiums............................................................. $26,460 $25,914 $22,970
Universallifeandinvestment-typeproductpolicyfees ................................ 5,203 5,381 5,238
Netinvestmentincome .................................................... 14,838 16,291 18,057
Otherrevenues ......................................................... 2,329 1,586 1,465
Net investment gains (losses):
Other-than-temporaryimpairmentsonfixedmaturitysecurities........................... (2,439) (1,296) (78)
Other-than-temporary impairments on fixed maturity securities transferred to other comprehensive
loss ............................................................... 939 — —
Othernetinvestmentgains(losses),net ......................................... (6,272) 3,108 (500)
Totalnetinvestmentgains(losses) ........................................ (7,772) 1,812 (578)
Totalrevenues...................................................... 41,058 50,984 47,152
Expenses
Policyholderbenefitsandclaims .............................................. 28,336 27,437 23,783
Interestcreditedtopolicyholderaccountbalances .................................. 4,849 4,788 5,461
Policyholderdividends..................................................... 1,650 1,751 1,723
Otherexpenses......................................................... 10,556 11,947 10,405
Totalexpenses ..................................................... 45,391 45,923 41,372
Income(loss)fromcontinuingoperationsbeforeprovisionforincometax.................... (4,333) 5,061 5,780
Provisionforincometaxexpense(benefit)........................................ (2,015) 1,580 1,675
Income(loss)fromcontinuingoperations,netofincometax ............................ (2,318) 3,481 4,105
Income(loss)fromdiscontinuedoperations,netofincometax........................... 40 (203) 360
Netincome(loss)........................................................ (2,278) 3,278 4,465
Less:Netincome(loss)attributabletononcontrollinginterests........................... (32) 69 148
Netincome(loss)attributabletoMetLife,Inc. ..................................... (2,246) 3,209 4,317
Less:Preferredstockdividends............................................... 122 125 137
Netincome(loss)availabletoMetLife,Inc.’scommonshareholders ....................... $(2,368) $ 3,084 $ 4,180
Income (loss) from continuing operations, net of income tax, available to MetLife, Inc.’s common
shareholders per common share:
Basic .............................................................. $ (2.94) $ 4.60 $ 5.32
Diluted ............................................................. $ (2.94) $ 4.54 $ 5.20
Net income (loss) available to MetLife, Inc.’s common shareholders per common share:
Basic .............................................................. $ (2.89) $ 4.19 $ 5.62
Diluted ............................................................. $ (2.89) $ 4.14 $ 5.48
Cashdividendspercommonshare ............................................ $ 0.74 $ 0.74 $ 0.74
See accompanying notes to the consolidated financial statements.
F-3MetLife, Inc.