MetLife 2009 Annual Report Download - page 60
Download and view the complete annual report
Please find page 60 of the 2009 MetLife annual report below. You can navigate through the pages in the report by either clicking on the pages listed below, or by using the keyword search tool below to find specific information within the annual report.-
 1
1 -
2
-
3
-
4
-
5
-
6
-
7
-
8
-
9
-
10
-
11
-
12
-
13
-
14
-
15
-
16
-
17
-
18
-
19
-
20
-
21
-
22
-
23
-
24
-
25
-
26
-
27
-
28
-
29
-
30
-
31
-
32
-
33
-
34
-
35
-
36
-
37
-
38
-
39
-
40
-
41
-
42
-
43
-
44
-
45
-
46
-
47
-
48
-
49
-
 50
50 -
 51
51 -
 52
52 -
 53
53 -
 54
54 -
 55
55 -
 56
56 -
 57
57 -
 58
58 -
 59
59 -
 60
60 -
 61
61 -
 62
62 -
 63
63 -
 64
64 -
 65
65 -
 66
66 -
 67
67 -
 68
68 -
 69
69 -
 70
70 -
71
-
72
-
73
-
74
-
75
-
76
-
77
-
78
-
79
-
80
-
81
-
82
-
83
-
84
-
85
-
86
-
87
-
88
-
89
-
90
-
91
-
92
-
93
-
94
-
95
-
96
-
97
-
98
-
99
-
100
-
101
-
102
-
103
-
104
-
105
-
106
-
107
-
108
-
109
-
110
-
111
-
112
-
113
-
114
-
115
-
116
-
117
-
118
-
119
-
120
-
121
-
122
-
123
-
124
-
125
-
126
-
127
-
128
-
129
-
130
-
131
-
132
-
133
-
134
-
135
-
136
-
137
-
138
-
139
-
140
-
141
-
142
-
143
-
144
-
145
-
146
-
147
-
148
-
149
-
150
-
151
-
152
-
153
-
154
-
155
-
156
-
157
-
158
-
159
-
160
-
161
-
162
-
163
-
164
-
165
-
166
-
167
-
168
-
169
-
170
-
171
-
172
-
173
-
174
-
175
-
176
-
177
-
178
-
179
-
180
-
181
-
182
-
183
-
184
-
185
-
186
-
187
-
188
-
189
-
190
-
191
-
192
-
193
-
194
-
195
-
196
-
197
-
198
-
199
-
200
-
201
-
202
-
203
-
204
-
205
-
206
-
207
-
208
-
209
-
210
-
211
-
212
-
213
-
214
-
215
-
216
-
217
-
218
-
219
-
220
 |
 |

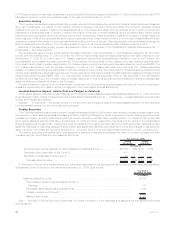
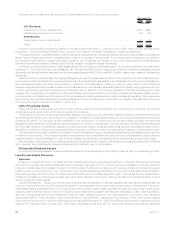
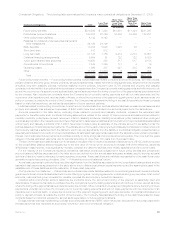
The table below contains the carrying value for guarantees included in future policy benefits at:
2009 2008
December 31,
(In millions)
U.S. Business:
Guaranteedminimumdeathbenefit.............................................. $137 $204
Guaranteedminimumincomebenefit............................................. 394 403
International:
Guaranteedminimumdeathbenefit.............................................. 23 39
Total.................................................................. $554 $646
Included in policyholder benefits and claims for the year ended December 31, 2009 is a credit of $92 million and for the year ended
December 31, 2008 is a charge of $498 million, related to the respective change in liabilities for the above guarantees.
The carrying amount of guarantees accounted for as insurance liabilities can change significantly during periods of sizable and sustained
shifts in equity market performance, increased equity volatility, or changes in interest rates. The Company uses reinsurance in combination
with derivative instruments to mitigate the liability exposure, risk of loss and the volatility of net income associated with these liabilities.
Derivative instruments used are primarily equity futures, treasury futures and interest rate swaps.
Included in policyholder benefits and claims associated with the hedging of the guarantees in future policy benefits for the year ended
December 31, 2009 and 2008 were gains (losses) of ($114) million and $182 million, respectively, related to reinsurance treaties containing
embedded derivatives carried at estimated fair value and gains (losses) of ($376) million and $331 million, respectively, related to freestanding
derivatives.
While the Company believes that the hedging strategies employed for guarantees included in both policyholder account balances and in
future policy benefits, as well as other management actions, have mitigated the risks related to these benefits, the Company remains liable for
the guaranteed benefits in the event that reinsurers or derivative counterparties are unable or unwilling to pay. Certain of the Company’s
reinsurance agreements and derivative positions are collateralized and derivatives positions are subject to master netting agreements, both
of which, significantly reduces the exposure to counterparty risk. In addition, the Company is subject to the risk that hedging and other
management procedures prove ineffective or that unanticipated policyholder behavior or mortality, combined with adverse market events,
produces economic losses beyond the scope of the risk management techniques employed. Lastly, because the valuation of the guarantees
accounted for as embedded derivatives includes an adjustment for the Company’s own credit that is not hedged, changes in the Company’s
own credit may result in significant volatility in net income.
Other Policyholder Funds
Other policyholder funds include policy and contract claims, unearned revenue liabilities, premiums received in advance, policyholder
dividends due and unpaid, and policyholder dividends left on deposit.
The liability for policy and contract claims generally relates to incurred but not reported death, disability, long-term care and dental claims,
as well as claims that have been reported but not yet settled. The liability for these claims is based on the Company’s estimated ultimate cost
of settling all claims. The Company derives estimates for the development of incurred but not reported claims principally from actuarial
analyses of historical patterns of claims and claims development for each line of business. The methods used to determine these estimates
are continually reviewed. Adjustments resulting from this continuous review process and differences between estimates and payments for
claims are recognized in policyholder benefits and claims expense in the period in which the estimates are changed or payments are made.
The unearned revenue liability relates to universal life-type and investment-type products and represents policy charges for services to be
provided in future periods. The charges are deferred as unearned revenue and amortized using the product’s estimated gross profits and
margins, similar to deferred acquisition costs. Such amortization is recorded in universal life and investment-type product policy fees.
Also included in other policyholder funds are policyholder dividends due and unpaid on participating policies and policyholder dividends
left on deposit. Such liabilities are presented at amounts contractually due to policyholders.
Policyholder Dividends Payable
Policyholder dividends payable consists of liabilities related to dividends payable in the following calendar year on participating policies.
Liquidity and Capital Resources
Overview
Beginning in September 2008, the global financial markets experienced unprecedented disruption, adversely affecting the business
environment in general, as well as financial services companies in particular. The U.S. economy entered a recession in January 2008 and
most economists believe this recession ended in the third quarter of 2009 when positive growth returned. Most economists now expect
positive growth to continue through 2010. Conditions in the financial markets have materially improved, but financial institutions may have to
pay higher spreads over benchmark U.S. Treasury securities than before the market disruption began. There is still some uncertainty as to
whether the stressed conditions that prevailed during the market disruption could recur, which could affect the Company’s ability to meet
liquidity needs and obtain capital.
Liquidity Management. Based upon the strength of its franchise, diversification of its businesses and strong financial fundamentals, we
continue to believe that the Company has ample liquidity to meet business requirements under current market conditions and unlikely but
reasonably possible stress scenarios. The Company’s short-term liquidity position (cash, and cash equivalents and short-term investments,
excluding cash collateral received under the Company’s securities lending program that has been reinvested in cash, cash equivalents,
short-term investments and publicly-traded securities and cash collateral received from counterparties in connection with derivative
instruments) was $11.7 billion and $26.7 billion at December 31, 2009 and 2008, respectively. This reduction in short-term liquidity reflects
the continued improvement in market conditions during the year ended December 31, 2009. During 2009, the Company invested a portion of
its short-term liquidity position in longer term, high quality, liquid asset types such as U.S. government securities and agency residential
54 MetLife, Inc.