MetLife 2009 Annual Report Download - page 125
Download and view the complete annual report
Please find page 125 of the 2009 MetLife annual report below. You can navigate through the pages in the report by either clicking on the pages listed below, or by using the keyword search tool below to find specific information within the annual report.-
 1
1 -
2
-
3
-
4
-
5
-
6
-
7
-
8
-
9
-
10
-
11
-
12
-
13
-
14
-
15
-
16
-
17
-
18
-
19
-
20
-
21
-
22
-
23
-
24
-
25
-
26
-
27
-
28
-
29
-
30
-
31
-
32
-
33
-
34
-
35
-
36
-
37
-
38
-
39
-
40
-
41
-
42
-
43
-
44
-
45
-
46
-
47
-
48
-
49
-
50
-
51
-
52
-
53
-
54
-
55
-
56
-
57
-
58
-
59
-
60
-
61
-
62
-
63
-
64
-
65
-
66
-
67
-
68
-
69
-
70
-
71
-
72
-
73
-
74
-
75
-
76
-
77
-
78
-
79
-
80
-
81
-
82
-
83
-
84
-
85
-
86
-
87
-
88
-
89
-
90
-
91
-
92
-
93
-
94
-
95
-
96
-
97
-
98
-
99
-
100
-
101
-
102
-
103
-
104
-
105
-
106
-
107
-
108
-
109
-
110
-
111
-
112
-
113
-
114
-
 115
115 -
 116
116 -
 117
117 -
 118
118 -
 119
119 -
 120
120 -
 121
121 -
 122
122 -
 123
123 -
 124
124 -
 125
125 -
 126
126 -
 127
127 -
 128
128 -
 129
129 -
 130
130 -
 131
131 -
 132
132 -
 133
133 -
 134
134 -
 135
135 -
136
-
137
-
138
-
139
-
140
-
141
-
142
-
143
-
144
-
145
-
146
-
147
-
148
-
149
-
150
-
151
-
152
-
153
-
154
-
155
-
156
-
157
-
158
-
159
-
160
-
161
-
162
-
163
-
164
-
165
-
166
-
167
-
168
-
169
-
170
-
171
-
172
-
173
-
174
-
175
-
176
-
177
-
178
-
179
-
180
-
181
-
182
-
183
-
184
-
185
-
186
-
187
-
188
-
189
-
190
-
191
-
192
-
193
-
194
-
195
-
196
-
197
-
198
-
199
-
200
-
201
-
202
-
203
-
204
-
205
-
206
-
207
-
208
-
209
-
210
-
211
-
212
-
213
-
214
-
215
-
216
-
217
-
218
-
219
-
220
 |
 |

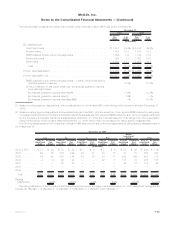
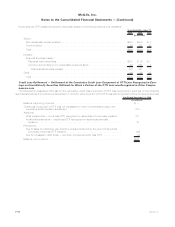
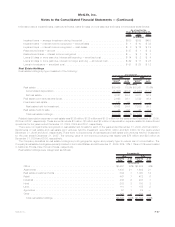
Proceeds from sales or disposals of fixed maturity and equity securities and the components of fixed maturity and equity securities net
investment gains (losses) are as follows:
2009 2008 2007 2009 2008 2007 2009 2008 2007
Years Ended December 31, Years Ended December 31, Years Ended December 31,
Fixed Maturity Securities Equity Securities Total
(In millions)
Proceeds . . . . . . . . . . . . . . . . . . . $38,972 $62,495 $78,001 $ 950 $2,107 $1,112 $39,922 $64,602 $79,113
Gross investment gains . . . . . . . . . . 947 858 554 134 440 226 1,081 1,298 780
Gross investment losses . . . . . . . . . (1,110) (1,515) (1,091) (133) (263) (43) (1,243) (1,778) (1,134)
Total OTTI losses recognized in
earnings:
Credit-related . . . . . . . . . . . . . . . (1,137) (1,138) (58) — — — (1,137) (1,138) (58)
Other(1) . . . . . . . . . . . . . . . . . . (363) (158) (20) (400) (430) (19) (763) (588) (39)
Total OTTI losses recognized in
earnings . . . . . . . . . . . . . . . . . (1,500) (1,296) (78) (400) (430) (19) (1,900) (1,726) (97)
Net investment gains (losses) . . . . . . $ (1,663) $ (1,953) $ (615) $(399) $ (253) $ 164 $ (2,062) $ (2,206) $ (451)
(1) Other OTTI losses recognized in earnings include impairments on equity securities, impairments on perpetual hybrid securities classified
within fixed maturity securities where the primary reason for the impairment was the severity and/or the duration of an unrealized loss
position and fixed maturity securities where there is an intent to sell or it is more likely than not that the Company will be required to sell the
security before recovery of the decline in estimated fair value.
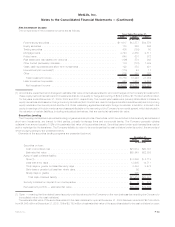
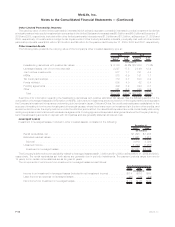
The Company periodically disposes of fixed maturity and equity securities at a loss. Generally, such losses are insignificant in amount or in
relation to the cost basis of the investment, are attributable to declines in estimated fair value occurring in the period of the disposition or are
as a result of management’s decision to sell securities based on current conditions, or the Company’s need to shift the portfolio to maintain its
portfolio management objectives. Investment gains and losses on sales of securities are determined on a specific identification basis.
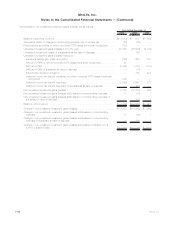
Fixed maturity security OTTI losses recognized in earnings relates to the following sectors and industries:
2009 2008 2007
Years Ended December 31,
(In millions)
U.S. and foreign corporate securities:
Finance....................................................... $ 459 $ 673 $18
Communications................................................. 235 134 —
Consumer ..................................................... 211 107 —
Utility ........................................................ 89 5 1
Industrial ...................................................... 30 26 18
Other ........................................................ 26 185 28
TotalU.S.andforeigncorporatesecurities............................... 1,050 1,130 65
RMBS........................................................ 193 — —
ABS ......................................................... 168 99 13
CMBS........................................................ 88 65 —
Foreigngovernmentsecurities ........................................ 1 2 —
Total ....................................................... $1,500 $1,296 $78
F-41MetLife, Inc.
MetLife, Inc.
Notes to the Consolidated Financial Statements — (Continued)