MetLife 2009 Annual Report Download - page 74
Download and view the complete annual report
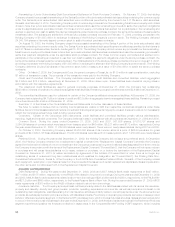
Please find page 74 of the 2009 MetLife annual report below. You can navigate through the pages in the report by either clicking on the pages listed below, or by using the keyword search tool below to find specific information within the annual report.The Holding Company entered into a net worth maintenance agreement with Mitsui Sumitomo MetLife Insurance Company Limited
(“MSMIC”), an investment in Japan of which the Holding Company owns 50% of the equity. Under the agreement, the Holding Company
agreed, without limitation as to amount, to cause MSMIC to have the amount of capital and surplus necessary for MSMIC to maintain a
solvency ratio of at least 400%, as calculated in accordance with the Insurance Business Law of Japan, and to make such loans to MSMIC as
may be necessary to ensure that MSMIC has sufficient cash or other liquid assets to meet its payment obligations as they fall due.
The Holding Company has guaranteed the obligations of its subsidiary, Exeter Reassurance Company, Ltd., under a reinsurance
agreement with MSMIC, under which Exeter reinsures variable annuity business written MSMIC.
Based on our analysis and comparison of our current and future cash inflows from the dividends we receive from subsidiaries that are
permitted to be paid without prior insurance regulatory approval, our asset portfolio and other cash flows and anticipated access to the capital
markets, we believe there will be sufficient liquidity and capital toenabletheHoldingCompanytomakepaymentsondebt,makecash
dividend payments on its common and preferred stock, contribute capital to its subsidiaries, pay all operating expenses and meet its cash
needs.
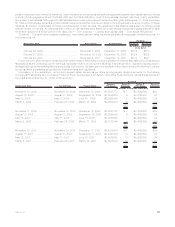
Holding Company Cash Flows. Net cash used in operating activities was $384 million for the year ended December 31, 2009 compared
to $1.2 billion of net cash provided for the year ending December 31, 2008. Accordingly, net cash provided by operating activities decreased
by $1.6 billion for the year ended December 31, 2009 as compared to the year ended December 31, 2008. The net cash generated from
operating activities is used to meet the Holding Company’s liquidity needs, such as debt and dividend payments, and provides cash available
for investing activities. Cash flows from operations represent net earnings adjusted for non-cash charges and changes in operating assets
and liabilities. The 2009 and 2008 operating activities included net income (loss), earnings from subsidiaries and changes in current assets
and liabilities.
Net cash provided by operating activities, primarily the result of subsidiary dividends, was $1.2 billion for the years ending December 31,
2008 and 2007.
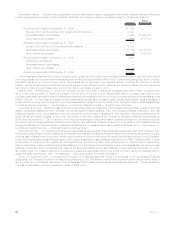
Net cash provided by financing activities was $2.6 billion and $50 million for the years ended December 31, 2009 and 2008, respectively.
Accordingly, net cash provided by financing activities increased by $2.5 billion for the year ended December 31, 2009 compared to the year
ended December 31, 2008. During the year ended December 31, 2009, there were net issuances of $2.1 billion of long-term and junior
subordinated debt compared to no net issuances in the comparable period of the prior year. Also, in order to strengthen its capital base,
during the year ended December 31, 2009, the Holding Company did not repurchase any of its common stock under its common stock
repurchase programs as compared to the Holding Company repurchasing $1.3 billion of its common stock in the comparable period of the
prior year. In addition, the Holding Company issued $1.0 billion of common stock during the year ended December 31, 2009 compared with
$3.3 billion of both treasury and common stock issued during the year ended December 31, 2008. Securities lending activity during the year
ended December 31, 2009 increased the Holding Company’s cash flows by $84 million compared to a decrease of $471 million in the
comparable period of the prior year. Net cash received from collateral financing arrangements was $375 million during the year ended
December 31, 2009 compared to $800 million of net cash paid under these agreements during the year ended December 31, 2008. The
Holding Company repaid $300 million of short-term debt during the year ended December 31, 2009, compared with net repayments of
$10 million during the year ended December 31, 2008. Financing activity results relate to the Holding Company’s debt and equity financing
activities, as well as changes due to the needs and obligations arising from securities lending and collateral financing arrangements.
Net cash provided by financing activities was $50 million for the year ended December 31, 2008 compared to $2.9 billion of net cash used
for the year ended December 31, 2007. Accordingly, net cash provided by financing activities increased by $2.9 billion for the year ended
December 31, 2008 compared to the prior year. In 2008, net cash paid relating to collateral financing arrangements was $800 million resulting
from payments made by the Holding Company to an unaffiliated financial institution, as described in Note 12 of the Notes to the Consolidated
Financial Statements, compared to zero outflows for this purpose in 2007. Finally, in order to strengthen its capital base, in 2008 the Holding
Company reduced its level of common stock repurchase activity by $500 million compared to the prior year and issued $3.3 billion of common
stock compared with zero issuance in 2007.
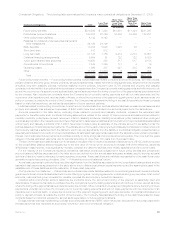
Net cash used in investing activities was $2.2 billion and $1.2 billion for the years ended December 31, 2009 and 2008, respectively.
Accordingly, net cash used in investing activities increased by $1.0 billion for the year ended December 31, 2009 compared to the year ended
December 31, 2008. Net purchases of fixed maturity securities were $2.0 billion for the year ended December 31, 2009, partially funded by
net sales of short-term investments of $772 million. By contrast, in the year ended December 31, 2008, net sales of fixed maturity securities
were $1.0 billion, and net purchases of short-term investments were $1.1 billion as the Holding Company shifted to more liquid investments.
The Holding Company received $130 million for the sale of a subsidiary during the year ended December 31, 2009 as compared to the use of
$202 million related to acquisitions during the year ended December 31, 2008. The Holding Company also made capital contributions of
$876 million to subsidiaries (including $360 million paid pursuant to a collateral financing arrangement providing statutory reserve support for
MRSC associated with its intercompany reinsurance obligations, as described in Note 12 of the Notes to the Consolidated Financial
Statements) during the year ended December 31, 2009, compared to $1.3 billion (including $320 million paid pursuant to the collateral
financing arrangement related to MRSC) during the year ended December 31, 2008. There were no repayments of loans made to subsidiaries
in the year ended December 31, 2009 compared to a repayment of $400 million received in the year ended December 31, 2008. Investing
activity results relate to the Holding Company’s management of its capital and the capital of its subsidiaries, as well as any business
development opportunities.
Net cash used in investing activities was $1.2 billion for the year ended December 31, 2008 compared to $742 million provided for the year
ended December 31, 2007. Accordingly, net cash provided by investing activities decreased by $1.9 billion for the year ended December 31,
2008 compared to the prior year primarily due to increases in capital contributions to subsidiaries and changes in short-term investments.
Adoption of New Accounting Pronouncements
See Note 1 of the Notes to the Consolidated Financial Statements for discussion on the adoption of new accounting pronouncements.
Future Adoption of New Accounting Pronouncements
See Note 1 of the Notes to the Consolidated Financial Statements for discussion on the future adoption of new accounting
pronouncements.
68 MetLife, Inc.


