MetLife 2009 Annual Report Download - page 41
Download and view the complete annual report
Please find page 41 of the 2009 MetLife annual report below. You can navigate through the pages in the report by either clicking on the pages listed below, or by using the keyword search tool below to find specific information within the annual report.-
 1
1 -
2
-
3
-
4
-
5
-
6
-
7
-
8
-
9
-
10
-
11
-
12
-
13
-
14
-
15
-
16
-
17
-
18
-
19
-
20
-
21
-
22
-
23
-
24
-
25
-
26
-
27
-
28
-
29
-
30
-
 31
31 -
 32
32 -
 33
33 -
 34
34 -
 35
35 -
 36
36 -
 37
37 -
 38
38 -
 39
39 -
 40
40 -
 41
41 -
 42
42 -
 43
43 -
 44
44 -
 45
45 -
 46
46 -
 47
47 -
 48
48 -
 49
49 -
 50
50 -
 51
51 -
52
-
53
-
54
-
55
-
56
-
57
-
58
-
59
-
60
-
61
-
62
-
63
-
64
-
65
-
66
-
67
-
68
-
69
-
70
-
71
-
72
-
73
-
74
-
75
-
76
-
77
-
78
-
79
-
80
-
81
-
82
-
83
-
84
-
85
-
86
-
87
-
88
-
89
-
90
-
91
-
92
-
93
-
94
-
95
-
96
-
97
-
98
-
99
-
100
-
101
-
102
-
103
-
104
-
105
-
106
-
107
-
108
-
109
-
110
-
111
-
112
-
113
-
114
-
115
-
116
-
117
-
118
-
119
-
120
-
121
-
122
-
123
-
124
-
125
-
126
-
127
-
128
-
129
-
130
-
131
-
132
-
133
-
134
-
135
-
136
-
137
-
138
-
139
-
140
-
141
-
142
-
143
-
144
-
145
-
146
-
147
-
148
-
149
-
150
-
151
-
152
-
153
-
154
-
155
-
156
-
157
-
158
-
159
-
160
-
161
-
162
-
163
-
164
-
165
-
166
-
167
-
168
-
169
-
170
-
171
-
172
-
173
-
174
-
175
-
176
-
177
-
178
-
179
-
180
-
181
-
182
-
183
-
184
-
185
-
186
-
187
-
188
-
189
-
190
-
191
-
192
-
193
-
194
-
195
-
196
-
197
-
198
-
199
-
200
-
201
-
202
-
203
-
204
-
205
-
206
-
207
-
208
-
209
-
210
-
211
-
212
-
213
-
214
-
215
-
216
-
217
-
218
-
219
-
220
 |
 |

For privately placed fixed maturity securities, the Company determines the estimated fair value generally through matrix pricing or
discounted cash flow techniques. The discounted cash flow valuations rely upon the estimated future cash flows of the security, credit
spreads of comparable public securities and secondary transactions, as well as taking account of, among other factors, the credit quality of
the issuer and the reduced liquidity associated with privately placed debt securities.
The Company has reviewed the significance and observability of inputs used in the valuation methodologies to determine the appropriate
fair value hierarchy level for each of its securities. Based on the results of this review and investment class analyses, each instrument is
categorized as Level 1, 2 or 3 based on the priority of the inputs to the respective valuation methodologies. While prices for certain
U.S. Treasury, agency and government guaranteed fixed maturity securities, certain foreign government fixed maturity securities, exchange-
traded common stock and certain short-term money market securities have been classified into Level 1 because of high volumes of trading
activity and narrow bid/ask spreads, most securities valued by independent pricing services have been classified into Level 2 because the
significant inputs used in pricing these securities are market observable or can be corroborated using market observable information. Most
investment grade privately placed fixed maturity securities have been classified within Level 2, while most below investment grade or
distressed privately placed fixed maturity securities have been classified within Level 3. Where estimated fair values are determined by
independent pricing services or by independent non-binding broker quotations that utilize inputs that are not market observable or cannot be
derived principally from or corroborated by observable market data, these instruments have been classified as Level 3. Use of independent
non-binding broker quotations generally indicates there is a lack of liquidity or the general lack of transparency in the process to develop these
price estimates causing them to be considered Level 3.
Effective April 1, 2009, the Company adopted new accounting guidance that clarified existing guidance regarding (1) estimating the
estimated fair value of an asset or liability if there was a significant decrease in the volume and level of trading activity for these assets or
liabilities and (2) identifying transactions that are not orderly. The Company’s valuation policies as described above and in “— Summary of
Critical Accounting Estimates — Estimated Fair Values of Investments” already incorporated the key concepts from this additional guidance,
accordingly, this guidance results in no material changes in our valuation policies. At April 1, 2009 and at each subsequent quarterly period in
2009, we evaluated the markets that our fixed maturity and equity securities trade in and in our judgment, despite the increased illiquidity
discussed above, believe none of these fixed maturity and equity securities trading markets should be characterized as distressed and
disorderly. We will continue to re-evaluate and monitor such fixed maturity and equity securities trading markets on an ongoing basis.
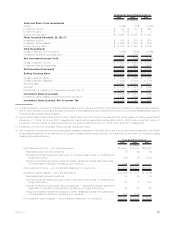
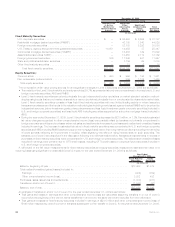
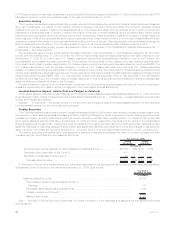
Fair Value Hierarchy. Fixed maturity securities and equity securities measured at estimated fair value on a recurring basis and their
corresponding fair value pricing sources and fair value hierarchy are as follows:
Fixed Maturity
Securities Equity
Securities
December 31, 2009
(In millions)
Quotedpricesinactivemarketsforidenticalassets(Level1) ....................... $ 11,257 5.0% $ 490 15.9%
Independent pricing source . . . . . . . . . . . . . . . . . . . . . . . . . . . . . . . . . . . . . . . . . . . . . 171,217 75.2 394 12.8
Internalmatrixpricingordiscountedcashflowtechniques ......................... 27,978 12.3 960 31.1
Significant other observable inputs (Level 2) . . . . . . . . . . . . . . . . . . . . . . . . . . . . . . . . . . 199,195 87.5 1,354 43.9
Independentpricingsource............................................. 7,336 3.2 909 29.5
Internalmatrixpricingordiscountedcashflowtechniques ......................... 7,089 3.1 254 8.2
Independentbrokerquotations........................................... 2,765 1.2 77 2.5
Significantunobservableinputs(Level3) .................................... 17,190 7.5 1,240 40.2
Total estimated fair value . . . . . . . . . . . . . . . . . . . . . . . . . . . . . . . . . . . . . . . . . . . . . . . $227,642 100.0% $3,084 100.0%
35MetLife, Inc.