MetLife 2009 Annual Report Download - page 80
Download and view the complete annual report
Please find page 80 of the 2009 MetLife annual report below. You can navigate through the pages in the report by either clicking on the pages listed below, or by using the keyword search tool below to find specific information within the annual report.-
 1
1 -
2
-
3
-
4
-
5
-
6
-
7
-
8
-
9
-
10
-
11
-
12
-
13
-
14
-
15
-
16
-
17
-
18
-
19
-
20
-
21
-
22
-
23
-
24
-
25
-
26
-
27
-
28
-
29
-
30
-
31
-
32
-
33
-
34
-
35
-
36
-
37
-
38
-
39
-
40
-
41
-
42
-
43
-
44
-
45
-
46
-
47
-
48
-
49
-
50
-
51
-
52
-
53
-
54
-
55
-
56
-
57
-
58
-
59
-
60
-
61
-
62
-
63
-
64
-
65
-
66
-
67
-
68
-
69
-
 70
70 -
 71
71 -
 72
72 -
 73
73 -
 74
74 -
 75
75 -
 76
76 -
 77
77 -
 78
78 -
 79
79 -
 80
80 -
 81
81 -
 82
82 -
 83
83 -
 84
84 -
 85
85 -
 86
86 -
 87
87 -
 88
88 -
 89
89 -
 90
90 -
91
-
92
-
93
-
94
-
95
-
96
-
97
-
98
-
99
-
100
-
101
-
102
-
103
-
104
-
105
-
106
-
107
-
108
-
109
-
110
-
111
-
112
-
113
-
114
-
115
-
116
-
117
-
118
-
119
-
120
-
121
-
122
-
123
-
124
-
125
-
126
-
127
-
128
-
129
-
130
-
131
-
132
-
133
-
134
-
135
-
136
-
137
-
138
-
139
-
140
-
141
-
142
-
143
-
144
-
145
-
146
-
147
-
148
-
149
-
150
-
151
-
152
-
153
-
154
-
155
-
156
-
157
-
158
-
159
-
160
-
161
-
162
-
163
-
164
-
165
-
166
-
167
-
168
-
169
-
170
-
171
-
172
-
173
-
174
-
175
-
176
-
177
-
178
-
179
-
180
-
181
-
182
-
183
-
184
-
185
-
186
-
187
-
188
-
189
-
190
-
191
-
192
-
193
-
194
-
195
-
196
-
197
-
198
-
199
-
200
-
201
-
202
-
203
-
204
-
205
-
206
-
207
-
208
-
209
-
210
-
211
-
212
-
213
-
214
-
215
-
216
-
217
-
218
-
219
-
220
 |
 |

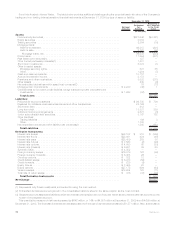
(1) Estimated fair value presented in the table above represents the estimated fair value of all financial instruments within this financial
statement caption not necessarily those solely subject to foreign exchange risk.
(2) Embedded derivatives are recognized in the consolidated balance sheet in the same caption as the host contract.
Foreign currency exchange rate risk increased by $365 million, or 69%, to $891 million at December 31, 2009 from $526 million at
December 31, 2008. This increase was due to an increase in fixed maturities of $567 million due to higher net exposures primarily to the
Canadian dollar, the British pound and the Euro. Partially offsetting this change was a decrease in the foreign exposure related to the use of
derivatives employed by the Company of $273 million. The remainder of the fluctuation is attributable to numerous immaterial items.
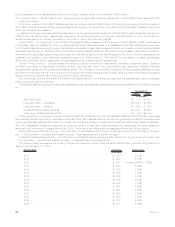
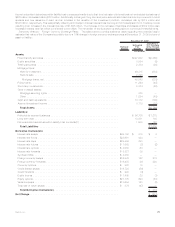
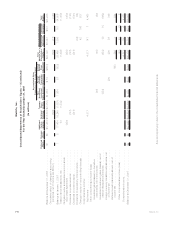
Sensitivity Analysis: Equity Prices. The table below provides additional detail regarding the potential loss in estimated fair value of the
Company’s portfolio due to a 10% change in equity at December 31, 2009 by type of asset or liability:
Notional
Amount
Estimated
Fair
Value(1)
Assuming a
10% Increase
in Equity
Prices
December 31, 2009
(In millions)
Assets:
Equitysecurities..................................................... $ 3,084 $337
Other invested assets:
Netembeddedderivativeswithinassethostcontracts(2)........................... 76 (10)
Total Assets ..................................................... $327
Liabilities:
Policyholderaccountbalances ........................................... $96,735 $ —
Other liabilities:
Netembeddedderivativeswithinliabilityhostcontracts(2).......................... 1,505 414
Total Liabilities ................................................... $414
Derivative Instruments:
Interestrateswaps................................................... $38,152 $ 315 $ —
Interestratefloors.................................................... $23,691 424 —
Interestratecaps.................................................... $28,409 283 —
Interestratefutures................................................... $ 7,563 (2) —
Interestrateoptions .................................................. $ 4,050 60 —
Interestrateforwards.................................................. $ 9,921 39 —
SyntheticGICs...................................................... $ 4,352 — —
Foreigncurrencyswaps................................................ $16,879 122 —
Foreigncurrencyforwards .............................................. $ 6,485 26 —
Currencyoptions .................................................... $ 822 18 —
Creditdefaultswaps.................................................. $ 6,723 (56) —
Creditforwards ..................................................... $ 220 (4) —
Equityfutures ...................................................... $ 7,405 23 (228)
Equityoptions ...................................................... $27,175 694 (754)
Varianceswaps ..................................................... $13,654 123 10
Totalrateofreturnswaps............................................... $ 376 (47) 13
Total Derivative Instruments ......................................... $(959)
Net Change ........................................................ $(218)
(1) Estimated fair value presented in the table above represents the estimated fair value of all financial instruments within this financial
statement caption not necessarily those solely subject to equity price risk.
(2) Embedded derivatives are recognized in the consolidated balance sheet in the same caption as the host contract.
Equity price risk increased by $42 million to $218 million at December 31, 2009 from $176 million at December 31, 2008. This increase is
due to an increase of risk of $219 million attributed to the use of derivatives employed by the Company to hedge its equity exposures, partially
offset by an increase in equity securities of $119 million and an increase in net embedded derivatives within liability host contracts of
$53 million. The remainder is attributable to numerous immaterial items.
74 MetLife, Inc.