MetLife 2009 Annual Report Download - page 86
Download and view the complete annual report
Please find page 86 of the 2009 MetLife annual report below. You can navigate through the pages in the report by either clicking on the pages listed below, or by using the keyword search tool below to find specific information within the annual report.-
 1
1 -
2
-
3
-
4
-
5
-
6
-
7
-
8
-
9
-
10
-
11
-
12
-
13
-
14
-
15
-
16
-
17
-
18
-
19
-
20
-
21
-
22
-
23
-
24
-
25
-
26
-
27
-
28
-
29
-
30
-
31
-
32
-
33
-
34
-
35
-
36
-
37
-
38
-
39
-
40
-
41
-
42
-
43
-
44
-
45
-
46
-
47
-
48
-
49
-
50
-
51
-
52
-
53
-
54
-
55
-
56
-
57
-
58
-
59
-
60
-
61
-
62
-
63
-
64
-
65
-
66
-
67
-
68
-
69
-
70
-
71
-
72
-
73
-
74
-
75
-
 76
76 -
 77
77 -
 78
78 -
 79
79 -
 80
80 -
 81
81 -
 82
82 -
 83
83 -
 84
84 -
 85
85 -
 86
86 -
 87
87 -
 88
88 -
 89
89 -
 90
90 -
 91
91 -
 92
92 -
 93
93 -
 94
94 -
 95
95 -
 96
96 -
97
-
98
-
99
-
100
-
101
-
102
-
103
-
104
-
105
-
106
-
107
-
108
-
109
-
110
-
111
-
112
-
113
-
114
-
115
-
116
-
117
-
118
-
119
-
120
-
121
-
122
-
123
-
124
-
125
-
126
-
127
-
128
-
129
-
130
-
131
-
132
-
133
-
134
-
135
-
136
-
137
-
138
-
139
-
140
-
141
-
142
-
143
-
144
-
145
-
146
-
147
-
148
-
149
-
150
-
151
-
152
-
153
-
154
-
155
-
156
-
157
-
158
-
159
-
160
-
161
-
162
-
163
-
164
-
165
-
166
-
167
-
168
-
169
-
170
-
171
-
172
-
173
-
174
-
175
-
176
-
177
-
178
-
179
-
180
-
181
-
182
-
183
-
184
-
185
-
186
-
187
-
188
-
189
-
190
-
191
-
192
-
193
-
194
-
195
-
196
-
197
-
198
-
199
-
200
-
201
-
202
-
203
-
204
-
205
-
206
-
207
-
208
-
209
-
210
-
211
-
212
-
213
-
214
-
215
-
216
-
217
-
218
-
219
-
220
 |
 |

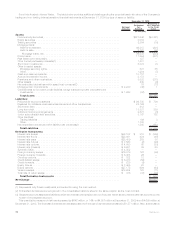
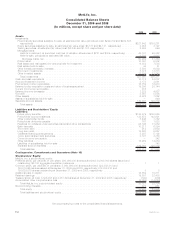
MetLife, Inc.
Consolidated Balance Sheets
December 31, 2009 and 2008
(In millions, except share and per share data)
2009 2008
Assets
Investments:
Fixed maturity securities available-for-sale, at estimated fair value (amortized cost: $229,709 and $209,508,
respectively) .............................................................. $227,642 $188,251
Equity securities available-for-sale, at estimated fair value (cost: $3,187 and $4,131, respectively) . . . . . . . . 3,084 3,197
Trading securities, at estimated fair value (cost: $2,249 and $1,107, respectively) . . . . . . . . . . . . . . . . . . 2,384 946
Mortgage loans:
Held-for-investment, at amortized cost (net of valuation allowances of $721 and $304, respectively) . . . . . 48,181 49,352
Held-for-sale,principallyatestimatedfairvalue........................................ 2,728 2,012
Mortgageloans,net........................................................ 50,909 51,364
Policyloans................................................................ 10,061 9,802
Realestateandrealestatejointventuresheld-for-investment................................ 6,852 7,535
Realestateheld-for-sale........................................................ 44 51
Otherlimitedpartnershipinterests.................................................. 5,508 6,039
Short-terminvestments ........................................................ 8,374 13,878
Otherinvestedassets ......................................................... 12,709 17,248
Total investments . . . . . . . . . . . . . . . . . . . . . . . . . . . . . . . . . . . . . . . . . . . . . . . . . . . . . . . . . . . 327,567 298,311
Cashandcashequivalents ....................................................... 10,112 24,207
Accruedinvestmentincome....................................................... 3,173 3,061
Premiumsandotherreceivables .................................................... 16,752 16,973
Deferredpolicyacquisitioncostsandvalueofbusinessacquired............................... 19,256 20,144
Currentincometaxrecoverable..................................................... 316 —
Deferredincometaxassets ....................................................... 1,228 4,927
Goodwill ................................................................... 5,047 5,008
Otherassets................................................................. 6,822 7,262
Assetsofsubsidiariesheld-for-sale .................................................. — 946
Separate account assets . . . . . . . . . . . . . . . . . . . . . . . . . . . . . . . . . . . . . . . . . . . . . . . . . . . . . . . . . 149,041 120,839
Totalassets .............................................................. $539,314 $501,678
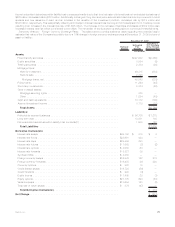
Liabilities and Stockholders’ Equity
Liabilities:
Futurepolicybenefits.......................................................... $135,879 $130,555
Policyholder account balances . . . . . . . . . . . . . . . . . . . . . . . . . . . . . . . . . . . . . . . . . . . . . . . . . . . . 138,673 142,921
Otherpolicyholderfunds........................................................ 8,446 7,762
Policyholderdividendspayable ................................................... 761 1,023
Payablesforcollateralundersecuritiesloanedandothertransactions .......................... 24,196 31,059
Bankdeposits .............................................................. 10,211 6,884
Short-termdebt ............................................................. 912 2,659
Long-termdebt.............................................................. 13,220 9,667
Collateralfinancingarrangements.................................................. 5,297 5,192
Juniorsubordinateddebtsecurities................................................. 3,191 3,758
Currentincometaxpayable...................................................... — 342
Otherliabilities .............................................................. 15,989 14,284
Liabilitiesofsubsidiariesheld-for-sale ............................................... — 748
Separate account liabilities . . . . . . . . . . . . . . . . . . . . . . . . . . . . . . . . . . . . . . . . . . . . . . . . . . . . . . 149,041 120,839
Total liabilities . . . . . . . . . . . . . . . . . . . . . . . . . . . . . . . . . . . . . . . . . . . . . . . . . . . . . . . . . . . . . 505,816 477,693
Contingencies, Commitments and Guarantees (Note 16)
Stockholders’ Equity:
MetLife, Inc.’s stockholders’ equity:
Preferred stock, par value $0.01 per share; 200,000,000 shares authorized; 84,000,000 shares issued and
outstanding;$2,100aggregateliquidationpreference..................................... 1 1
Common stock, par value $0.01 per share; 3,000,000,000 shares authorized; 822,359,818 and
798,016,664 shares issued at December 31, 2009 and 2008, respectively; 818,833,810 and
793,629,070 shares outstanding at December 31, 2009 and 2008, respectively . . . . . . . . . . . . . . . . . . . 8 8
Additionalpaid-incapital......................................................... 16,859 15,811
Retainedearnings ............................................................. 19,501 22,403
Treasury stock, at cost; 3,526,008 and 4,387,594 shares at December 31, 2009 and 2008, respectively . . . . (190) (236)
Accumulatedothercomprehensiveloss ............................................... (3,058) (14,253)
TotalMetLife,Inc.’sstockholders’equity............................................ 33,121 23,734
Noncontrollinginterests.......................................................... 377 251
Totalequity............................................................... 33,498 23,985
Totalliabilitiesandstockholders’equity............................................. $539,314 $501,678
See accompanying notes to the consolidated financial statements.
F-2 MetLife, Inc.