MetLife 2009 Annual Report Download - page 132
Download and view the complete annual report
Please find page 132 of the 2009 MetLife annual report below. You can navigate through the pages in the report by either clicking on the pages listed below, or by using the keyword search tool below to find specific information within the annual report.-
 1
1 -
2
-
3
-
4
-
5
-
6
-
7
-
8
-
9
-
10
-
11
-
12
-
13
-
14
-
15
-
16
-
17
-
18
-
19
-
20
-
21
-
22
-
23
-
24
-
25
-
26
-
27
-
28
-
29
-
30
-
31
-
32
-
33
-
34
-
35
-
36
-
37
-
38
-
39
-
40
-
41
-
42
-
43
-
44
-
45
-
46
-
47
-
48
-
49
-
50
-
51
-
52
-
53
-
54
-
55
-
56
-
57
-
58
-
59
-
60
-
61
-
62
-
63
-
64
-
65
-
66
-
67
-
68
-
69
-
70
-
71
-
72
-
73
-
74
-
75
-
76
-
77
-
78
-
79
-
80
-
81
-
82
-
83
-
84
-
85
-
86
-
87
-
88
-
89
-
90
-
91
-
92
-
93
-
94
-
95
-
96
-
97
-
98
-
99
-
100
-
101
-
102
-
103
-
104
-
105
-
106
-
107
-
108
-
109
-
110
-
111
-
112
-
113
-
114
-
115
-
116
-
117
-
118
-
119
-
120
-
121
-
 122
122 -
 123
123 -
 124
124 -
 125
125 -
 126
126 -
 127
127 -
 128
128 -
 129
129 -
 130
130 -
 131
131 -
 132
132 -
 133
133 -
 134
134 -
 135
135 -
 136
136 -
 137
137 -
 138
138 -
 139
139 -
 140
140 -
 141
141 -
 142
142 -
143
-
144
-
145
-
146
-
147
-
148
-
149
-
150
-
151
-
152
-
153
-
154
-
155
-
156
-
157
-
158
-
159
-
160
-
161
-
162
-
163
-
164
-
165
-
166
-
167
-
168
-
169
-
170
-
171
-
172
-
173
-
174
-
175
-
176
-
177
-
178
-
179
-
180
-
181
-
182
-
183
-
184
-
185
-
186
-
187
-
188
-
189
-
190
-
191
-
192
-
193
-
194
-
195
-
196
-
197
-
198
-
199
-
200
-
201
-
202
-
203
-
204
-
205
-
206
-
207
-
208
-
209
-
210
-
211
-
212
-
213
-
214
-
215
-
216
-
217
-
218
-
219
-
220
 |
 |

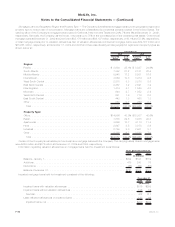
Other Limited Partnership Interests
The carrying value of other limited partnership interests (which primarily represent ownership interests in pooled investment funds that
principally make private equity investments in companies in the United States and overseas) was $5.5 billion and $6.0 billion at December 31,
2009 and 2008, respectively. Included within other limited partnership interests were $1.0 billion and $1.3 billion, at December 31, 2009 and
2008, respectively, of investments in hedge funds. Impairments of other limited partnership interests, principally cost method other limited
partnership interests, were $354 million, $105 million and $4 million for the years ended December 31, 2009, 2008 and 2007, respectively.
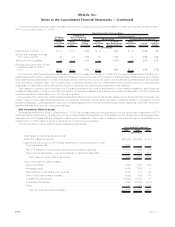
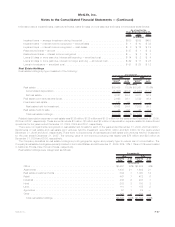
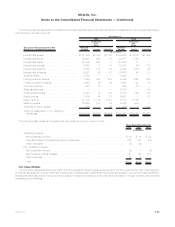
Other Invested Assets
The following table presents the carrying value of the Company’s other invested assets by type at:
Carrying
Value %of
Total Carrying
Value %of
Total
2009 2008
December 31,
(In millions)
Freestandingderivativeswithpositivefairvalues ..................... $ 6,133 48.2% $12,306 71.3%
Leveragedleases,netofnon-recoursedebt........................ 2,227 17.5 2,146 12.4
Jointventureinvestments.................................... 977 7.7 751 4.4
MSRs................................................. 878 6.9 191 1.1
Taxcreditpartnerships...................................... 719 5.7 503 2.9
Fundswithheld........................................... 505 4.0 62 0.4
Fundingagreements ....................................... 409 3.2 394 2.3
Other................................................. 861 6.8 895 5.2
Total . . . . . . . . . . . . . . . . . . . . . . . . . . . . . . . . . . . . . . . . . . . . . . . . $12,709 100.0% $17,248 100.0%
See Note 4 for information regarding the freestanding derivatives with positive estimated fair values. See the following section for the
composition of leveraged leases and information on MSRs. Joint venture investments are accounted for on the equity method and represent
the Company’s investment in insurance underwriting joint ventures in Japan, Chile and China. Tax credit partnerships are established for the
purpose of investing in low-income housing and other social causes, where the primary return on investment is in the form of tax credits, and
are accounted for under the equity method or under the effective yield method. Funds withheld represent amounts contractually withheld by
ceding companies in accordance with reinsurance agreements. Funding agreements represent arrangements where the Company has long-
term interest bearing amounts on deposit with third parties and are generally stated at amortized cost.
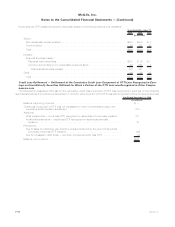
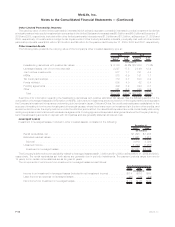
Leveraged Leases
Investment in leveraged leases, included in other invested assets, consisted of the following:
2009 2008
December 31,
(In millions)
Rentalreceivables,net .................................................. $1,698 $1,486
Estimatedresidualvalues................................................. 1,921 1,913
Subtotal .......................................................... 3,619 3,399
Unearnedincome...................................................... (1,392) (1,253)
Investmentinleveragedleases............................................ $2,227 $2,146
The Company’s deferred income tax liability related to leveraged leases was $1.3 billion and $1.2 billion at December 31, 2009 and 2008,
respectively. The rental receivables set forth above are generally due in periodic installments. The payment periods range from one to
15 years, but in certain circumstances are as long as 30 years.
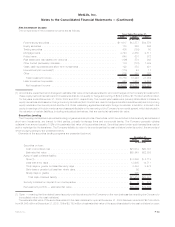
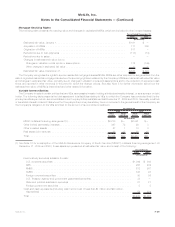
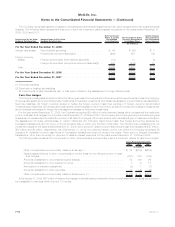
The components of net income from investment in leveraged leases are as follows:
2009 2008 2007
Years Ended December 31,
(In millions)
Income from investment in leveraged leases (included in net investment income) . . . . . . . . . . $114 $116 $ 68
Less:Incometaxexpenseonleveragedleases................................ (40) (40) (24)
Netincomefrominvestmentinleveragedleases............................... $ 74 $ 76 $44
F-48 MetLife, Inc.
MetLife, Inc.
Notes to the Consolidated Financial Statements — (Continued)