MetLife 2009 Annual Report Download - page 26
Download and view the complete annual report
Please find page 26 of the 2009 MetLife annual report below. You can navigate through the pages in the report by either clicking on the pages listed below, or by using the keyword search tool below to find specific information within the annual report.-
 1
1 -
2
-
3
-
4
-
5
-
6
-
7
-
8
-
9
-
10
-
11
-
12
-
13
-
14
-
15
-
 16
16 -
 17
17 -
 18
18 -
 19
19 -
 20
20 -
 21
21 -
 22
22 -
 23
23 -
 24
24 -
 25
25 -
 26
26 -
 27
27 -
 28
28 -
 29
29 -
 30
30 -
 31
31 -
 32
32 -
 33
33 -
 34
34 -
 35
35 -
 36
36 -
37
-
38
-
39
-
40
-
41
-
42
-
43
-
44
-
45
-
46
-
47
-
48
-
49
-
50
-
51
-
52
-
53
-
54
-
55
-
56
-
57
-
58
-
59
-
60
-
61
-
62
-
63
-
64
-
65
-
66
-
67
-
68
-
69
-
70
-
71
-
72
-
73
-
74
-
75
-
76
-
77
-
78
-
79
-
80
-
81
-
82
-
83
-
84
-
85
-
86
-
87
-
88
-
89
-
90
-
91
-
92
-
93
-
94
-
95
-
96
-
97
-
98
-
99
-
100
-
101
-
102
-
103
-
104
-
105
-
106
-
107
-
108
-
109
-
110
-
111
-
112
-
113
-
114
-
115
-
116
-
117
-
118
-
119
-
120
-
121
-
122
-
123
-
124
-
125
-
126
-
127
-
128
-
129
-
130
-
131
-
132
-
133
-
134
-
135
-
136
-
137
-
138
-
139
-
140
-
141
-
142
-
143
-
144
-
145
-
146
-
147
-
148
-
149
-
150
-
151
-
152
-
153
-
154
-
155
-
156
-
157
-
158
-
159
-
160
-
161
-
162
-
163
-
164
-
165
-
166
-
167
-
168
-
169
-
170
-
171
-
172
-
173
-
174
-
175
-
176
-
177
-
178
-
179
-
180
-
181
-
182
-
183
-
184
-
185
-
186
-
187
-
188
-
189
-
190
-
191
-
192
-
193
-
194
-
195
-
196
-
197
-
198
-
199
-
200
-
201
-
202
-
203
-
204
-
205
-
206
-
207
-
208
-
209
-
210
-
211
-
212
-
213
-
214
-
215
-
216
-
217
-
218
-
219
-
220
 |
 |

and government guaranteed fixed maturity securities and, to a lesser extent, certain other invested asset classes including real estate joint
ventures and other invested assets to provide additional diversification and opportunity for long-term yield enhancement.
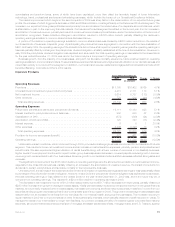
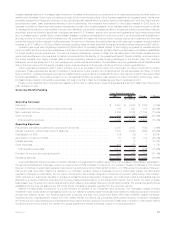
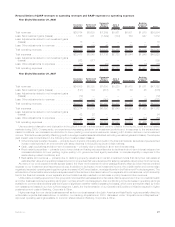
Other expenses were essentially flat despite an increase of $137 million from the impact of market conditions on certain expenses,
primarily pension and postretirement benefit costs. This increase was partially offset by a decrease of $85 million, predominantly from
declines in information technology, travel, and professional services, including the positive impact of our Operational Excellence initiative. A
further reduction of expenses was achieved through a decrease in variable expenses, such as commissions and premium taxes of
$46 million, a portion of which is offset by DAC capitalization.
The aforementioned declines in operating earnings were partially offset by the favorable impact of a $63 million decrease in policyholder
dividends in the traditional life business, the result of a dividend scale reduction in the fourth quarter of 2009. In addition, favorable mortality in
the individual life business was partially offset by higher benefit utilization in the dental business during 2009, reflecting the negative
employment trends in the marketplace. The net impact of these two items benefited operating earnings by $36 million. The 2009 results were
also favorably impacted by our review of assumptions used to determine estimated gross profits and margins, which in turn are factors in
determining the amortization for DAC and unearned revenue. This review resulted in an unlocking event related to unearned revenue and,
coupled with the impact from the prior year’s review, generated an increase in operating earnings of $82 million. This increase was recorded in
universal life and investment-type product policy fees. Partially offsetting these increases was the impact of lower separate account balances,
whichresultedinlowerfeeincomeof$25million.
DAC amortization reflects lower current year amortization of $108 million, stemming from the impact of the improvement in the financial
markets in 2009, which increased our expected future gross profits, as well as lower current year gross margins in the closed block. This
decrease was partially offset by the net impact of refinements in both the prior and current years of $98 million, the majority of which was
recorded in the prior year as a result of the 2008 review of certain DAC related assumptions.
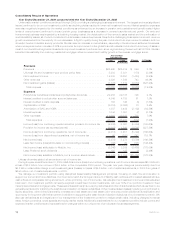
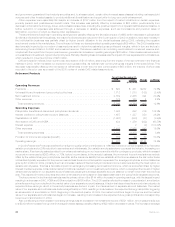
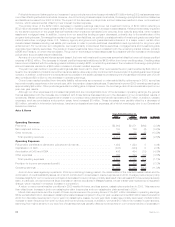
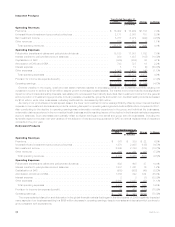
Retirement Products
2009 2008 Change % Change
Years Ended December 31,
(In millions)
Operating Revenues
Premiums.................................................... $ 623 $ 361 $262 72.6%
Universallifeandinvestment-typeproductpolicyfees ....................... 1,712 1,870 (158) (8.4)%
Netinvestmentincome ........................................... 2,859 2,365 494 20.9%
Otherrevenues ................................................ 172 168 4 2.4%
Totaloperatingrevenues......................................... 5,366 4,764 602 12.6%
Operating Expenses
Policyholder benefits and claims and policyholder dividends . . . . . . . . . . . . . . . . . . . 1,398 692 706 102.0%
Interestcreditedtopolicyholderaccountbalances ......................... 1,687 1,337 350 26.2%
CapitalizationofDAC ............................................ (1,067) (980) (87) (8.9)%
AmortizationofDACandVOBA...................................... 424 1,356 (932) (68.7)%
Interestexpense ............................................... — 2 (2) (100.0)%
Otherexpenses................................................ 2,405 2,065 340 16.5%
Totaloperatingexpenses ........................................ 4,847 4,472 375 8.4%
Provisionforincometaxexpense(benefit)............................... 182 99 83 83.8%
Operatingearnings.............................................. $ 337 $ 193 $144 74.6%
In 2009, Retirement Products benefited from a flight to quality, which contributed to a 10% improvement in combined sales of our fixed and
variable products and a 28% reduction in surrenders and withdrawals. Our variable annuity sales have out paced the industry, increasing our
market share. Fixed annuity sales benefited from enhanced marketing on our income annuity with life contingency products, which increased
our premium revenues by $262 million, or 73%, before income taxes. In the annuity business, the movement in premiums is almost entirely
offset by the related change in policyholder benefits, as the insurance liability that we establish at the time we assume the risk under these
contracts is typically equivalent to the premium earned less the amount of acquisition expenses. Our average policyholder account balances
grew by $7.2 billion in 2009, primarily due to an increase in sales of fixed annuity products and more customers electing the fixed option on
variable annuity sales. This has a favorable impact on earnings by increasing net investment income, which is somewhat offset by higher
interest credited expense. Unfavorable market conditions resulted in poor investment performance, which outweighed the impact of higher
variable annuity sales on our separate account balances causing the average separate account balance to remain lower than the previous
year. This resulted in lower policy fees and other revenues which are based on daily asset balances in the policyholder separate accounts.
The improvement in the financial markets was the primary driver of the $144 million increase in operating earnings, with the largest impact
resulting in a decrease in DAC, VOBA and DSI amortization of $655 million. The 2008 results reflected increased, or accelerated, amortization
primarily stemming from a decline in the market value of our separate account balances. A factor that determines the amount of amortization is
expected future earnings, which in the annuity business are derived, in part, from fees earned on separate account balances. The market
value of our separate account balances declined significantly in 2008, resulting in a decrease in the expected future gross profits, triggering
an acceleration of amortization in 2008. Beginning in the second quarter of 2009, the market conditions began to improve and the market
value of our separate account balances began to increase, resulting in an increase in the expected future gross profits and a corresponding
lower level of amortization in 2009.
Also contributing to the increase in operating earnings was an increase in net investment income of $321 million, which was primarily due
to a $343 million increase from growth in average invested assets, partially offset by a $22 million decrease in yields. The increase in average
20 MetLife, Inc.