MetLife 2009 Annual Report Download - page 45
Download and view the complete annual report
Please find page 45 of the 2009 MetLife annual report below. You can navigate through the pages in the report by either clicking on the pages listed below, or by using the keyword search tool below to find specific information within the annual report.-
 1
1 -
2
-
3
-
4
-
5
-
6
-
7
-
8
-
9
-
10
-
11
-
12
-
13
-
14
-
15
-
16
-
17
-
18
-
19
-
20
-
21
-
22
-
23
-
24
-
25
-
26
-
27
-
28
-
29
-
30
-
31
-
32
-
33
-
34
-
 35
35 -
 36
36 -
 37
37 -
 38
38 -
 39
39 -
 40
40 -
 41
41 -
 42
42 -
 43
43 -
 44
44 -
 45
45 -
 46
46 -
 47
47 -
 48
48 -
 49
49 -
 50
50 -
 51
51 -
 52
52 -
 53
53 -
 54
54 -
 55
55 -
56
-
57
-
58
-
59
-
60
-
61
-
62
-
63
-
64
-
65
-
66
-
67
-
68
-
69
-
70
-
71
-
72
-
73
-
74
-
75
-
76
-
77
-
78
-
79
-
80
-
81
-
82
-
83
-
84
-
85
-
86
-
87
-
88
-
89
-
90
-
91
-
92
-
93
-
94
-
95
-
96
-
97
-
98
-
99
-
100
-
101
-
102
-
103
-
104
-
105
-
106
-
107
-
108
-
109
-
110
-
111
-
112
-
113
-
114
-
115
-
116
-
117
-
118
-
119
-
120
-
121
-
122
-
123
-
124
-
125
-
126
-
127
-
128
-
129
-
130
-
131
-
132
-
133
-
134
-
135
-
136
-
137
-
138
-
139
-
140
-
141
-
142
-
143
-
144
-
145
-
146
-
147
-
148
-
149
-
150
-
151
-
152
-
153
-
154
-
155
-
156
-
157
-
158
-
159
-
160
-
161
-
162
-
163
-
164
-
165
-
166
-
167
-
168
-
169
-
170
-
171
-
172
-
173
-
174
-
175
-
176
-
177
-
178
-
179
-
180
-
181
-
182
-
183
-
184
-
185
-
186
-
187
-
188
-
189
-
190
-
191
-
192
-
193
-
194
-
195
-
196
-
197
-
198
-
199
-
200
-
201
-
202
-
203
-
204
-
205
-
206
-
207
-
208
-
209
-
210
-
211
-
212
-
213
-
214
-
215
-
216
-
217
-
218
-
219
-
220
 |
 |

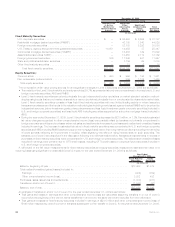
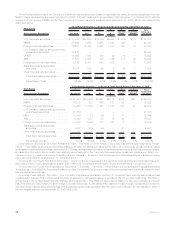
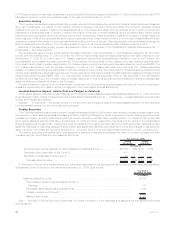
Structured Securities. The following table presents the types and portion rated Aaa/AAA, and portion rated NAIC 1 for RMBS and ABS
backed by sub-prime mortgage loans, of structured securities the Company held at:
Estimated
Fair
Value %of
Total
Estimated
Fair
Value %of
Total
2009 2008
December 31,
(In millions)
RMBS................................................ $44,020 60.5% $36,028 60.8%
CMBS................................................ 15,622 21.4 12,644 21.4
ABS ................................................. 13,162 18.1 10,523 17.8
Total structured securities . . . . . . . . . . . . . . . . . . . . . . . . . . . . . . . . . . . $72,804 100.0% $59,195 100.0%
Ratings profile:
RMBSratedAaa/AAA(1)................................... $35,626 80.9% $33,265 92.3%
RMBSratedNAIC1(2).................................... $38,464 87.4% $34,512 95.8%
CMBSratedAaa/AAA..................................... $13,355 85.5% $11,778 93.2%
ABSratedAaa/AAA(1).................................... $ 9,354 71.1% $ 7,934 75.4%
ABSratedNAIC1(2)..................................... $11,573 87.9% $ 9,393 89.3%
(1) Based on rating agency designations, without adjustment for the revised NAIC methodology which became effective December 31, 2009.
(2) Based on rating agency designations and equivalent ratings of the NAIC, with the exception of non-agency RMBS (and for ABS —
including RMBS backed by sub-prime mortgage loans) held by the Company’s domestic insurance subsidiaries. Non-agency RMBS (and
for ABS — including RMBS backed by sub-prime mortgage loans) held by the Company’s domestic insurance subsidiaries at Decem-
ber 31, 2009 are included based on final ratings from the revised NAIC rating methodology which became effective December 31, 2009,
which may not correspond to rating agency designations.
RMBS. See Note 3 of the Notes to the Consolidated Financial Statements “Investments — Fixed Maturity and Equity Securities
Available-for-Sale — Concentrations of Credit Risk (Fixed Maturity Securities) — RMBS” for the tables that present the Company’s RMBS
holdings by security type and risk profile at December 31, 2009 and 2008.
The majority of the Company’s RMBS were rated Aaa/AAA by Moody’s,S&PorFitch;andthemajoritywereratedNAIC1bytheNAICat
December 31, 2009 and 2008, as presented above. Effective December 31, 2009, the NAIC adopted a revised rating methodology for non-
agency RMBS based on the NAIC’s estimate of expected losses from non-agency RMBS. The majority of the Company’s agency RMBS were
guaranteed or otherwise supported by the FNMA, the FHLMC or the GNMA. Non-agency RMBS includes prime and alternative residential
mortgage loans (“Alt-A”) RMBS. Prime residential mortgage lending includes the origination of residential mortgage loans to the most credit-
worthy borrowers with high quality credit profiles. Alt-A are a classification of mortgage loans where the risk profile of the borrower falls
between prime and sub-prime. Sub-prime mortgage lending is the origination of residential mortgage loans to borrowers with weak credit
profiles. During 2009, the major rating agencies made significant revisions to their methodologies and loss expectations for non-agency
RMBS, resulting in significant downgrades for both prime and Alt-A RMBS, contributing to the decrease in the percentage of RMBS with Aaa/
AAA ratings at December 31, 2009 as compared to December 31, 2008. Our analysis suggests that rating agencies are applying essentially
the same default methodology to all Alt-A securities regardless of the underlying collateral. The Company’s Alt-A securities portfolio has
superior structure to the overall Alt-A market. At December 31, 2009 and 2008, the Company’s Alt-A securities portfolio has no exposure to
option adjustable rate mortgages (“ARMs”) and a minimal exposure to hybrid ARMs. The Company’s Alt-A securities portfolio is comprised
primarily of fixed rate mortgages which have performed better than both option ARMs and hybrid ARMs in the overall Alt-A market. Additionally,
90% and 83% at December 31, 2009 and 2008, respectively, of the Company’s Alt-A securities portfolio has super senior credit
enhancement, which typically provides double the credit enhancement of a standard Aaa/AAA rated fixed maturity security. Based upon
the analysis of the Company’s exposure to Alt-A mortgage loans through its exposure to RMBS, the Company continues to expect to receive
payments in accordance with the contractual terms of the securities that are considered temporarily impaired. Any securities where the
present value of projected future cash flows expected to be collected is less than amortized cost are impaired in accordance with our
impairment policy. See Note 3 of the Notes to the Consolidated Financial Statements “Investments — Fixed Maturity Securities Availa-
ble-for-Sale — RMBS” for a table that presents the estimated fair value of Alt-A securities held by the Company by vintage year, net unrealized
loss, portion of holdings rated Aa/AA or better by Moody’s, S&P or Fitch, portion rated NAIC 1 by the NAIC, and portion of holdings that are
backed by fixed rate collateral or hybrid ARMs at December 31, 2009 and 2008. Vintage year refers to the year of origination and not to the
year of purchase.
CMBS. There have been disruptions in the CMBS market due to market perceptions that default rates will increase in part due to
weakness in commercial real estate market fundamentals and due in part to relaxed underwriting standards by some originators of
commercial mortgage loans within the more recent vintage years (i.e., 2006 and later). These factors have caused a pull-back in market
liquidity, increased credit spreads and repricing of risk, which has led to higher levels of unrealized losses as compared to historical levels.
However, in 2009 market conditions improved, credit spreads narrowed and unrealized losses decreased from 21% to 6% of cost or
amortized cost from December 31, 2008 to December 31, 2009. Based upon the analysis of the Company’s exposure to CMBS, the
Company expects to receive payments in accordance with the contractual terms of the securities that are considered temporarily impaired.
Any securities where the present value of projected future cash flows expected to be collected is less than amortized cost are impaired in
accordance with our impairment policy.
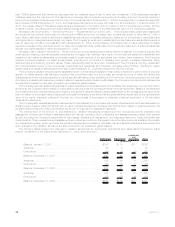
The Company’s holdings in CMBS were $15.6 billion and $12.6 billion, at estimated fair value at December 31, 2009 and 2008,
respectively. The cost or amortized cost and estimated fair value, rating distribution by Moody’s, S&P or Fitch, and holdings by vintage year of
such securities held by the Company at December 31, 2009 and 2008. The Company had no exposure to CMBS index securities and its
39MetLife, Inc.