MetLife 2009 Annual Report Download - page 40
Download and view the complete annual report
Please find page 40 of the 2009 MetLife annual report below. You can navigate through the pages in the report by either clicking on the pages listed below, or by using the keyword search tool below to find specific information within the annual report.-
 1
1 -
2
-
3
-
4
-
5
-
6
-
7
-
8
-
9
-
10
-
11
-
12
-
13
-
14
-
15
-
16
-
17
-
18
-
19
-
20
-
21
-
22
-
23
-
24
-
25
-
26
-
27
-
28
-
29
-
 30
30 -
 31
31 -
 32
32 -
 33
33 -
 34
34 -
 35
35 -
 36
36 -
 37
37 -
 38
38 -
 39
39 -
 40
40 -
 41
41 -
 42
42 -
 43
43 -
 44
44 -
 45
45 -
 46
46 -
 47
47 -
 48
48 -
 49
49 -
 50
50 -
51
-
52
-
53
-
54
-
55
-
56
-
57
-
58
-
59
-
60
-
61
-
62
-
63
-
64
-
65
-
66
-
67
-
68
-
69
-
70
-
71
-
72
-
73
-
74
-
75
-
76
-
77
-
78
-
79
-
80
-
81
-
82
-
83
-
84
-
85
-
86
-
87
-
88
-
89
-
90
-
91
-
92
-
93
-
94
-
95
-
96
-
97
-
98
-
99
-
100
-
101
-
102
-
103
-
104
-
105
-
106
-
107
-
108
-
109
-
110
-
111
-
112
-
113
-
114
-
115
-
116
-
117
-
118
-
119
-
120
-
121
-
122
-
123
-
124
-
125
-
126
-
127
-
128
-
129
-
130
-
131
-
132
-
133
-
134
-
135
-
136
-
137
-
138
-
139
-
140
-
141
-
142
-
143
-
144
-
145
-
146
-
147
-
148
-
149
-
150
-
151
-
152
-
153
-
154
-
155
-
156
-
157
-
158
-
159
-
160
-
161
-
162
-
163
-
164
-
165
-
166
-
167
-
168
-
169
-
170
-
171
-
172
-
173
-
174
-
175
-
176
-
177
-
178
-
179
-
180
-
181
-
182
-
183
-
184
-
185
-
186
-
187
-
188
-
189
-
190
-
191
-
192
-
193
-
194
-
195
-
196
-
197
-
198
-
199
-
200
-
201
-
202
-
203
-
204
-
205
-
206
-
207
-
208
-
209
-
210
-
211
-
212
-
213
-
214
-
215
-
216
-
217
-
218
-
219
-
220
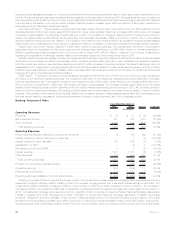
 |
 |
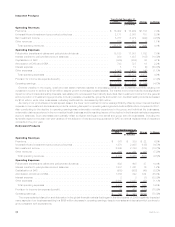
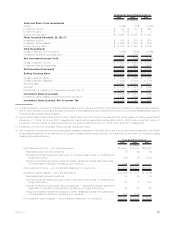
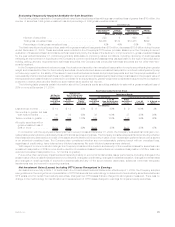
(5) Other invested assets were principally comprised of freestanding derivatives with positive estimated fair values and leveraged leases.
Freestanding derivatives with negative estimated fair values were included within other liabilities. As yield is not considered a meaningful
measure of performance for other invested assets it has been excluded from the yield table.
(6) The components of investment gains (losses) for the year-to-date ended December 31, 2008, are shown net of a realized gain under
purchased credit default swaps that offsets losses incurred on certain fixed maturity securities.
(7) Derivatives not qualifying for hedge accounting is comprised of amounts for freestanding derivatives of ($6,624) million, $6,072 million
and ($59) million; and embedded derivatives of $1,758 million, ($2,650) million and ($321) million for the years ended December 31,
2009, 2008 and 2007, respectively.
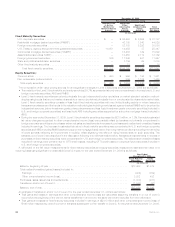
See “— Consolidated Results of Operations — Year Ended December 31, 2009 compared with the Year Ended December 31, 2008 and
Year Ended December 31, 2008 compared with the Year Ended December 31, 2007,” for an analysis of the period over period changes in net
investment income and net investment gains (losses).
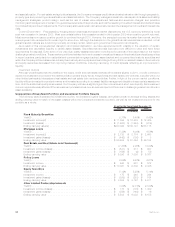
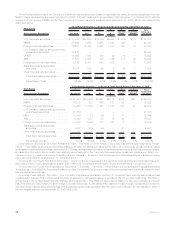
Fixed Maturity and Equity Securities Available-for-Sale
Fixed maturity securities, which consisted principally of publicly-traded and privately placed fixed maturity securities, were $227.6 billion
and $188.3 billion, or 67% and 58% of total cash and invested assets at estimated fair value, at December 31, 2009 and 2008, respectively.
Publicly-traded fixed maturity securities represented $191.4 billion and $156.7 billion, or 84% and 83% of total fixed maturity securities at
estimated fair value, at December 31, 2009 and 2008, respectively. Privately placed fixed maturity securities represented $36.2 billion and
$31.6 billion, or 16% and 17% of total fixed maturity securities at estimated fair value, at December 31, 2009 and 2008, respectively.
Equity securities, which consisted principally of publicly-traded and privately-held common and preferred stocks, including certain
perpetual hybrid securities and mutual fund interests, were $3.1 billion and $3.2 billion, or 0.9% and 1.0% of total cash and invested assets at
estimated fair value, at December 31, 2009 and 2008, respectively. Publicly-traded equity securities represented $2.1 billion and $2.1 billion,
or 68% and 66% of total equity securities at estimated fair value, at December 31, 2009 and 2008, respectively. Privately-held equity
securities represented $1.0 billion and $1.1 billion, or 32% and 34% of total equity securities at estimated fair value, at December 31, 2009
and 2008, respectively.
Valuation of Securities. We are responsible for the determination of estimated fair value. The estimated fair value of publicly-traded fixed
maturity, equity and trading securities, as well as short-term securities is determined by management after considering one of three primary
sources of information: quoted market prices in active markets, independent pricing services, or independent broker quotations. The number
of quotes obtained varies by instrument and depends on the liquidity of the particular instrument. Generally, we obtain prices from multiple
pricing services to cover all asset classes and obtain multiple prices for certain securities, but ultimately utilize the price with the highest
placement in the fair value hierarchy. Independent pricing services that value these instruments use market standard valuation methodologies
based on inputs that are market observable or can be derived principally from or corroborated by observable market data. Such observable
inputs include benchmarking prices for similar assets in active, liquid markets, quoted prices in markets that are not active and observable
yields and spreads in the market. The market standard valuation methodologies utilized include: discounted cash flow methodologies, matrix
pricing or similar techniques. The assumptions and inputs in applying these market standard valuation methodologies include, but are not
limited to, interest rates, credit standing of the issuer or counterparty, industry sector of the issuer, coupon rate, call provisions, sinking fund
requirements, maturity, estimated duration, and management’s assumptions regarding liquidity and estimated future cash flows. When a
price is not available in the active market or through an independent pricing service, management will value the security primarily using
independent non-binding broker quotations. Independent non-binding broker quotations utilize inputs that are not market observable or
cannot be derived principally from or corroborated by observable market data.
Senior management, independent of the trading and investing functions, is responsible for the oversight of control systems and valuation
policies, including reviewing and approving new transaction types and markets, for ensuring that observable market prices and market-based
parameters are used for valuation, wherever possible, and for determining that judgmental valuation adjustments, if any, are based upon
established policies and are applied consistently over time. We review our valuation methodologies on an ongoing basis and ensure that any
changes to valuation methodologies are justified. We gain assurance on the overall reasonableness and consistent application of input
assumptions, valuation methodologies and compliance with accounting standards for fair value determination through various controls
designed to ensure that the financial assets and financial liabilities are appropriately valued and represent an exit price. The control systems
and procedures include, but are not limited to, analysis of portfolio returns to corresponding benchmark returns, comparing a sample of
executed prices of securities sold to the fair value estimates, comparing fair value estimates to management’s knowledge of the current
market, reviewing the bid/ask spreads to assess activity and ongoing confirmation that independent pricing services use, wherever possible,
market-based parameters for valuation. We determine the observability of inputs used in estimated fair values received from independent
pricing services or brokers by assessing whether these inputs can be corroborated by observable market data. The Company also follows a
formal process to challenge any prices received from independent pricing services that are not considered representative of estimated fair
value. If we conclude that prices received from independent pricing services are not reflective of market activity or representative of estimated
fair value, we will seek independent non-binding broker quotes or use an internally developed valuation to override these prices. Such
overrides are classified as Level 3. Despite the credit events prevalent in the current markets, including market dislocation, volatility in
valuation of certain investments, and reduced levels of liquidity over the past few quarters, our internally developed valuations of current
estimated fair value, which reflect our estimates of liquidity and non- performance risks, compared with pricing received from the independent
pricing services, did not produce material differences for the vast majority of our fixed maturity securities portfolio. Our estimates of liquidity
and non-performance risks are generally based on available market evidence and on what other market participants would use. In the
absence of such evidence, management’s best estimate is used. As a result, we generally continued to use the price provided by the
independent pricing service under our normal pricing protocol and pricing overrides were not material. The Company uses the results of this
analysis for classifying the estimated fair value of these instruments in Level 1, 2 or 3. For example, we will review the estimated fair values
received to determine whether corroborating evidence (i.e., similar observable positions and actual trades) will support a Level 2 classification
in the fair value hierarchy. Security prices which cannot be corroborated due to relatively less pricing transparency and diminished liquidity will
be classified as Level 3. Even some of our very high quality invested assets have been more illiquid for periods of time as a result of the current
market conditions.
34 MetLife, Inc.