MetLife 2009 Annual Report Download - page 36
Download and view the complete annual report
Please find page 36 of the 2009 MetLife annual report below. You can navigate through the pages in the report by either clicking on the pages listed below, or by using the keyword search tool below to find specific information within the annual report.
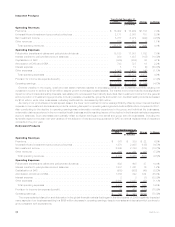
Auto & Home
2008 2007 Change % Change
Years Ended December 31,
(In millions)
Operating Revenues
Premiums .................................................... $2,971 $2,966 $ 5 0.2%
Netinvestmentincome............................................ 186 196 (10) (5.1)%
Otherrevenues................................................. 38 43 (5) (11.6)%
Totaloperatingrevenues ......................................... 3,195 3,205 (10) (0.3)%
Operating Expenses
Policyholder benefits and claims and policyholder dividends . . . . . . . . . . . . . . . . . . . . 1,924 1,811 113 6.2%
CapitalizationofDAC............................................. (444) (471) 27 5.7%
AmortizationofDACandVOBA ...................................... 454 468 (14) (3.0)%
Otherexpenses ................................................ 794 832 (38) (4.6)%
Totaloperatingexpenses......................................... 2,728 2,640 88 3.3%
Provisionforincometaxexpense(benefit) ............................... 104 139 (35) (25.2)%
Operatingearnings .............................................. $ 363 $ 426 $(63) (14.8)%
Significant weather-related catastrophe losses in the second and third quarters of 2008 were the primary cause for the $63 million decline
in operating earnings and resulted in an unfavorable change in the combined ratio, including catastrophes, to 91.2% in 2008 from 88.4% in
2007. Such losses were partially offset by a decrease in non-catastrophe losses due to lower severities in the auto line of business, offset
somewhat by higher frequencies in the homeowners line of business, which is reflected in the favorable change in the combined ratio,
excluding catastrophes, to 83.1% in 2008 from 86.3% in 2007.
In addition, net investment income decreased by $7 million primarily due to decreasing yields, partially offset by growth in average invested
assets. Yields were adversely impacted by the severe downturn in the global financial markets which impacted other limited partnership
interests and fixed maturity securities.
Finally, earned premiums were impacted by a modest increase in exposures, a decrease in the cost of reinsurance, and a decline in
average earned premium per policy.
International
2008 2007 Change % Change
Years Ended December 31,
(In millions)
Operating Revenues
Premiums .................................................... $3,470 $3,096 $374 12.1%
Universallifeandinvestment-typeproductpolicyfees........................ 1,095 995 100 10.1%
Netinvestmentincome............................................ 1,180 1,249 (69) (5.5)%
Otherrevenues................................................. 18 24 (6) (25.0)%
Totaloperatingrevenues ......................................... 5,763 5,364 399 7.4%
Operating Expenses
Policyholder benefits and claims and policyholder dividends . . . . . . . . . . . . . . . . . . . . 3,185 2,521 664 26.3%
Interestcreditedtopolicyholderaccountbalances.......................... 171 354 (183) (51.7)%
CapitalizationofDAC............................................. (798) (743) (55) (7.4)%
AmortizationofDACandVOBA ...................................... 381 309 72 23.3%
Interest expense . . . . . . . . . . . . . . . . . . . . . . . . . . . . . . . . . . . . . . . . . . . . . . . . 9 3 6 200.0%
Otherexpenses ................................................ 2,079 2,180 (101) (4.6)%
Totaloperatingexpenses......................................... 5,027 4,624 403 8.7%
Provisionforincometaxexpense(benefit) ............................... 257 172 85 49.4%
Operatingearnings .............................................. $ 479 $ 568 $ (89) (15.7)%
The reduction in operating earnings includes the adverse impact of changes in foreign currency exchange rates, which decreased
operating earnings by $11 million relative to 2007. Excluding the impact of changes in foreign currency exchange rates, operating earnings
decreased by $78 million, or 14%, from the comparable 2007 period. This decrease was primarily driven by difficult financial market
conditions in Japan, which adversely impacted investment results and increased DAC amortization relative to the prior year, as well as the
impact of pension reform in Argentina in 2007 and the nationalization of this business in 2008, which favorably impacted the prior year results
relative to the current year. Partially offsetting these decreases, the International segment benefited from the favorable impact of higher
inflation rates on inflation-indexed investments in Chile, as well as business growth in the Latin America and Asia Pacific regions.
30 MetLife, Inc.


