MetLife 2009 Annual Report Download - page 122
Download and view the complete annual report
Please find page 122 of the 2009 MetLife annual report below. You can navigate through the pages in the report by either clicking on the pages listed below, or by using the keyword search tool below to find specific information within the annual report.-
 1
1 -
2
-
3
-
4
-
5
-
6
-
7
-
8
-
9
-
10
-
11
-
12
-
13
-
14
-
15
-
16
-
17
-
18
-
19
-
20
-
21
-
22
-
23
-
24
-
25
-
26
-
27
-
28
-
29
-
30
-
31
-
32
-
33
-
34
-
35
-
36
-
37
-
38
-
39
-
40
-
41
-
42
-
43
-
44
-
45
-
46
-
47
-
48
-
49
-
50
-
51
-
52
-
53
-
54
-
55
-
56
-
57
-
58
-
59
-
60
-
61
-
62
-
63
-
64
-
65
-
66
-
67
-
68
-
69
-
70
-
71
-
72
-
73
-
74
-
75
-
76
-
77
-
78
-
79
-
80
-
81
-
82
-
83
-
84
-
85
-
86
-
87
-
88
-
89
-
90
-
91
-
92
-
93
-
94
-
95
-
96
-
97
-
98
-
99
-
100
-
101
-
102
-
103
-
104
-
105
-
106
-
107
-
108
-
109
-
110
-
111
-
 112
112 -
 113
113 -
 114
114 -
 115
115 -
 116
116 -
 117
117 -
 118
118 -
 119
119 -
 120
120 -
 121
121 -
 122
122 -
 123
123 -
 124
124 -
 125
125 -
 126
126 -
 127
127 -
 128
128 -
 129
129 -
 130
130 -
 131
131 -
 132
132 -
133
-
134
-
135
-
136
-
137
-
138
-
139
-
140
-
141
-
142
-
143
-
144
-
145
-
146
-
147
-
148
-
149
-
150
-
151
-
152
-
153
-
154
-
155
-
156
-
157
-
158
-
159
-
160
-
161
-
162
-
163
-
164
-
165
-
166
-
167
-
168
-
169
-
170
-
171
-
172
-
173
-
174
-
175
-
176
-
177
-
178
-
179
-
180
-
181
-
182
-
183
-
184
-
185
-
186
-
187
-
188
-
189
-
190
-
191
-
192
-
193
-
194
-
195
-
196
-
197
-
198
-
199
-
200
-
201
-
202
-
203
-
204
-
205
-
206
-
207
-
208
-
209
-
210
-
211
-
212
-
213
-
214
-
215
-
216
-
217
-
218
-
219
-
220
 |
 |
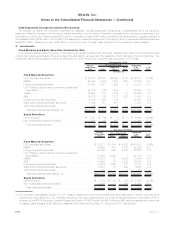
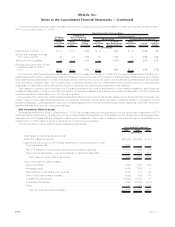
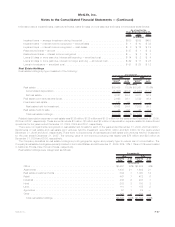
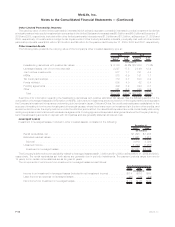
Aging of Gross Unrealized Loss and OTTI Loss for Fixed Maturity and Equity Securities Available-for-Sale
The following tables present the cost or amortized cost, gross unrealized loss, including the portion of OTTI loss on fixed maturity
securities recognized in accumulated other comprehensive loss at December 31, 2009, gross unrealized loss as a percentage of cost or
amortized cost and number of securities for fixed maturity and equity securities where the estimated fair value had declined and remained
below cost or amortized cost by less than 20%, or 20% or more at:
Less than
20% 20% or
more Less than
20% 20% or
more Less than
20% 20% or
more
Cost or Amortized Cost Gross Unrealized
Loss Number of
Securities
December 31, 2009
(In millions, except number of securities)
Fixed Maturity Securities:
Lessthansixmonths................................. $35,163 $ 2,658 $ 933 $ 713 1,725 186
Six months or greater but less than nine months . . . . . . . . . . . . . . . 4,908 674 508 194 124 49
Nine months or greater but less than twelve months . . . . . . . . . . . . . 1,723 1,659 167 517 106 79
Twelve months or greater . . . . . . . . . . . . . . . . . . . . . . . . . . . . . . 41,721 12,067 3,207 4,247 2,369 724
Total .......................................... $83,515 $17,058 $4,815 $5,671
Percentageofcostoramortizedcost ...................... 6% 33%
Equity Securities:
Lessthansixmonths................................. $ 66 $ 63 $ 7 $ 14 199 8
Sixmonthsorgreaterbutlessthanninemonths ............... 6 1 1 1 15 2
Nine months or greater but less than twelve months . . . . . . . . . . . . . 13 94 2 39 8 6
Twelvemonthsorgreater .............................. 610 488 73 138 50 24
Total .......................................... $ 695 $ 646 $ 83 $ 192
Percentageofcost .................................. 12% 30%
Less than
20% 20% or
more Less than
20% 20% or
more Less than
20% 20% or
more
Cost or Amortized Cost Gross Unrealized Loss Number of
Securities
December 31, 2008
(In millions, except number of securities)
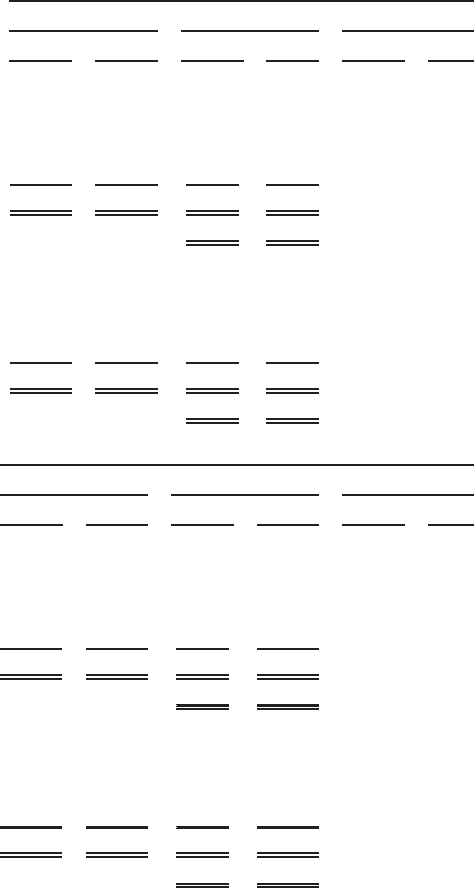
Fixed Maturity Securities:
Lessthansixmonths................................ $32,658 $48,114 $2,358 $17,191 4,566 2,827
Six months or greater but less than nine months . . . . . . . . . . . . . . 14,975 2,180 1,313 1,109 1,314 157
Nine months or greater but less than twelve months . . . . . . . . . . . . 16,372 3,700 1,830 2,072 934 260
Twelve months or greater . . . . . . . . . . . . . . . . . . . . . . . . . . . . . 23,191 650 2,533 415 1,809 102
Total ......................................... $87,196 $54,644 $8,034 $20,787
Percentageofcostoramortizedcost ..................... 9% 38%
Equity Securities:
Lessthansixmonths................................ $ 386 $ 1,190 $ 58 $ 519 351 551
Six months or greater but less than nine months . . . . . . . . . . . . . . 33 413 6 190 8 32
Nine months or greater but less than twelve months . . . . . . . . . . . . 3 487 — 194 5 15
Twelvemonthsorgreater ............................. 171 — 11 — 20 —
Total ......................................... $ 593 $ 2,090 $ 75 $ 903
Percentageofcost ................................. 13% 43%
Equity securities with a gross unrealized loss of 20% or more for twelve months or greater increased from none at December 31, 2008 to
$138 million at December 31, 2009. As shown in the section below “Evaluating Temporarily Impaired Available for Sale Securities,”the
$138 million of equity securities with a gross unrealized loss of 20% or more for twelve months or greater at December 31, 2009 were
investment grade non-redeemable preferred stock, of which $136 million were financial services industry investment grade non-redeemable
preferred stock, of which 62% were rated A or better.
F-38 MetLife, Inc.
MetLife, Inc.
Notes to the Consolidated Financial Statements — (Continued)