MetLife 2009 Annual Report Download - page 33
Download and view the complete annual report
Please find page 33 of the 2009 MetLife annual report below. You can navigate through the pages in the report by either clicking on the pages listed below, or by using the keyword search tool below to find specific information within the annual report.-
 1
1 -
2
-
3
-
4
-
5
-
6
-
7
-
8
-
9
-
10
-
11
-
12
-
13
-
14
-
15
-
16
-
17
-
18
-
19
-
20
-
21
-
22
-
 23
23 -
 24
24 -
 25
25 -
 26
26 -
 27
27 -
 28
28 -
 29
29 -
 30
30 -
 31
31 -
 32
32 -
 33
33 -
 34
34 -
 35
35 -
 36
36 -
 37
37 -
 38
38 -
 39
39 -
 40
40 -
 41
41 -
 42
42 -
 43
43 -
44
-
45
-
46
-
47
-
48
-
49
-
50
-
51
-
52
-
53
-
54
-
55
-
56
-
57
-
58
-
59
-
60
-
61
-
62
-
63
-
64
-
65
-
66
-
67
-
68
-
69
-
70
-
71
-
72
-
73
-
74
-
75
-
76
-
77
-
78
-
79
-
80
-
81
-
82
-
83
-
84
-
85
-
86
-
87
-
88
-
89
-
90
-
91
-
92
-
93
-
94
-
95
-
96
-
97
-
98
-
99
-
100
-
101
-
102
-
103
-
104
-
105
-
106
-
107
-
108
-
109
-
110
-
111
-
112
-
113
-
114
-
115
-
116
-
117
-
118
-
119
-
120
-
121
-
122
-
123
-
124
-
125
-
126
-
127
-
128
-
129
-
130
-
131
-
132
-
133
-
134
-
135
-
136
-
137
-
138
-
139
-
140
-
141
-
142
-
143
-
144
-
145
-
146
-
147
-
148
-
149
-
150
-
151
-
152
-
153
-
154
-
155
-
156
-
157
-
158
-
159
-
160
-
161
-
162
-
163
-
164
-
165
-
166
-
167
-
168
-
169
-
170
-
171
-
172
-
173
-
174
-
175
-
176
-
177
-
178
-
179
-
180
-
181
-
182
-
183
-
184
-
185
-
186
-
187
-
188
-
189
-
190
-
191
-
192
-
193
-
194
-
195
-
196
-
197
-
198
-
199
-
200
-
201
-
202
-
203
-
204
-
205
-
206
-
207
-
208
-
209
-
210
-
211
-
212
-
213
-
214
-
215
-
216
-
217
-
218
-
219
-
220
 |
 |

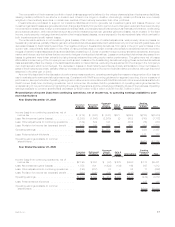
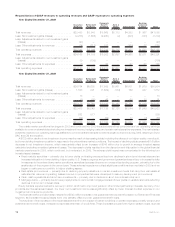
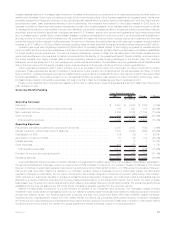
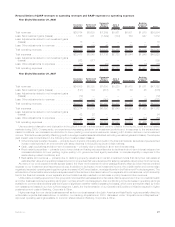
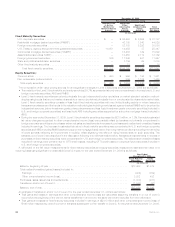
Reconciliation of GAAP revenues to operating revenues and GAAP expenses to operating expenses
Year Ended December 31, 2008
Insurance
Products Retirement
Products
Corporate
Benefit
Funding Auto &
Home International
Banking
Corporate
&Other Total
(In millions)
Total revenues . . . . . . . . . . . . . . . . . . . . . . . . . $26,754 $5,630 $ 7,559 $3,061 $6,001 $1,979 $50,984
Less: Net investment gains (losses) . . . . . . . . . . . 1,558 901 (1,629) (134) 169 947 1,812
Less: Adjustments related to net investment gains
(losses) ............................ 18 — — — — — 18
Less: Other adjustments to revenues . . . . . . . . . . (1) (35) 45 — 69 13 91
Total operating revenues . . . . . . . . . . . . . . . . . . $25,179 $4,764 $ 9,143 $3,195 $5,763 $1,019 $49,063
Total expenses . . . . . . . . . . . . . . . . . . . . . . . . . $23,418 $5,049 $ 7,735 $2,728 $5,044 $1,949 $45,923
Less: Adjustments related to net investment gains
(losses) ............................ 262 577 — — — — 839
Less: Other adjustments to expenses . . . . . . . . . . (52) — (29) — 17 (4) (68)
Total operating expenses . . . . . . . . . . . . . . . . . . $23,208 $4,472 $ 7,764 $2,728 $5,027 $1,953 $45,152
Year Ended December 31, 2007
Insurance
Products Retirement
Products
Corporate
Benefit
Funding Auto &
Home International
Banking
Corporate
&Other Total
(In millions)
Total revenues . . . . . . . . . . . . . . . . . . . . . . . . . $24,005 $5,338 $7,600 $3,220 $5,418 $1,571 $47,152
Less: Net investment gains (losses) . . . . . . . . . . . (121) 104 (677) 15 56 45 (578)
Less: Adjustments related to net investment gains
(losses) ............................ (12) — — — — — (12)
Less:Otheradjustmentstorevenues .......... (81) (31) (148) — (2) (9) (271)
Total operating revenues . . . . . . . . . . . . . . . . . . $24,219 $5,265 $8,425 $3,205 $5,364 $1,535 $48,013
Total expenses . . . . . . . . . . . . . . . . . . . . . . . . . $22,214 $3,908 $6,592 $2,640 $4,590 $1,428 $41,372
Less: Adjustments related to net investment gains
(losses) ............................ 62 22 — — — — 84
Less: Other adjustments to expenses . . . . . . . . . . 21 (21) 8 — (34) (24) (50)
Total operating expenses . . . . . . . . . . . . . . . . . . $22,131 $3,907 $6,584 $2,640 $4,624 $1,452 $41,338
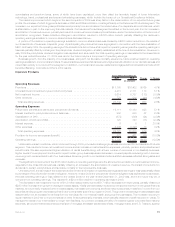
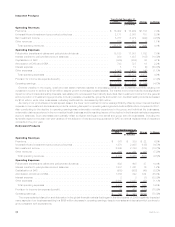
Unprecedented disruption and dislocation in the global financial markets caused extreme volatility in the equity, credit and real estate
markets during 2008. Consequently, we experienced decreasing yields on our investment portfolio and, in response to the extraordinary
market conditions, we increased our allocation to lower yielding, more liquid investments, causing a $1.4 billion decline in net investment
income. This decline was partially offset by growth in average invested assets calculated excluding unrealized gains and losses. The adverse
yield impact was concentrated in the following four invested asset classes:
• Other limited partnership interests — primarily due to the lack of liquidity and credit in the financial markets, as well as unprecedented
investor redemptions in an environment with steep declines in the public equity and debt markets;
• Cash, cash equivalents and short-term investments — primarily due to declines in short-term interest rates;
• Fixed maturity securities — primarily due to lower yields on floating rate securities due to declines in short-term interest rates and an
increased allocation to lower yielding, higher quality, U.S. government and agency securities, to increase liquidity in response to the
extraordinary market conditions; and
• Real estate joint ventures — primarily due to declining property valuations on certain investment funds that carry their real estate at
estimated fair value and operating losses incurred on properties that were developed for sale by real estate development joint ventures.
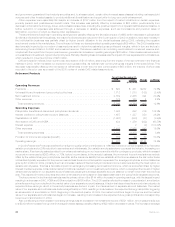
As many of our products are interest spread-based, the lower net investment income was significantly offset by lower interest credited
expense on our investment and insurance products. In addition to its impact on net investment income, the volatile market environment also
negatively impacted operating earnings through an increase in DAC amortization, most significantly in the Retirement Products segment. The
acceleration of amortization stemmed primarily as a result of the decline in the market value of our separate account balances, which is directly
tied to the financial markets. Lower separate account balances also resulted in a decrease in policy fees and other revenues.
Unfavorable mortality experience in the group and individual life businesses and unfavorable claims experience in the non-medical health
and other business reduced operating earnings in our Insurance Products segment. Also contributing to the decrease in operating earnings
available to common shareholders was the impact of significant weather-related catastrophe losses, which were somewhat offset by lower
non-catastrophe losses in our Auto & Home segment. Lastly, the implementation of our Operational Excellence initiative resulted in higher
postemployment costs in Banking, Corporate & Other.
Higher earnings from our dental business as well as from our businesses in the Latin America and Asia Pacific regions partially offset the
unfavorable impacts discussed above. In addition, our banking acquisitions in 2008, discussed under “Acquisitions and Dispositions,”
improved operating earnings available to common shareholders in Banking, Corporate & Other.
27MetLife, Inc.