Wells Fargo 2009 Annual Report Download - page 98
Download and view the complete annual report
Please find page 98 of the 2009 Wells Fargo annual report below. You can navigate through the pages in the report by either clicking on the pages listed below, or by using the keyword search tool below to find specific information within the annual report.-
 1
1 -
2
-
3
-
4
-
5
-
6
-
7
-
8
-
9
-
10
-
11
-
12
-
13
-
14
-
15
-
16
-
17
-
18
-
19
-
20
-
21
-
22
-
23
-
24
-
25
-
26
-
27
-
28
-
29
-
30
-
31
-
32
-
33
-
34
-
35
-
36
-
37
-
38
-
39
-
40
-
41
-
42
-
43
-
44
-
45
-
46
-
47
-
48
-
49
-
50
-
51
-
52
-
53
-
54
-
55
-
56
-
57
-
58
-
59
-
60
-
61
-
62
-
63
-
64
-
65
-
66
-
67
-
68
-
69
-
70
-
71
-
72
-
73
-
74
-
75
-
76
-
77
-
78
-
79
-
80
-
81
-
82
-
83
-
84
-
85
-
86
-
87
-
 88
88 -
 89
89 -
 90
90 -
 91
91 -
 92
92 -
 93
93 -
 94
94 -
 95
95 -
 96
96 -
 97
97 -
 98
98 -
 99
99 -
 100
100 -
 101
101 -
 102
102 -
 103
103 -
 104
104 -
 105
105 -
 106
106 -
 107
107 -
 108
108 -
109
-
110
-
111
-
112
-
113
-
114
-
115
-
116
-
117
-
118
-
119
-
120
-
121
-
122
-
123
-
124
-
125
-
126
-
127
-
128
-
129
-
130
-
131
-
132
-
133
-
134
-
135
-
136
-
137
-
138
-
139
-
140
-
141
-
142
-
143
-
144
-
145
-
146
-
147
-
148
-
149
-
150
-
151
-
152
-
153
-
154
-
155
-
156
-
157
-
158
-
159
-
160
-
161
-
162
-
163
-
164
-
165
-
166
-
167
-
168
-
169
-
170
-
171
-
172
-
173
-
174
-
175
-
176
-
177
-
178
-
179
-
180
-
181
-
182
-
183
-
184
-
185
-
186
-
187
-
188
-
189
-
190
-
191
-
192
-
193
-
194
-
195
-
196
 |
 |

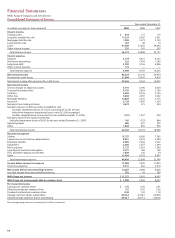
Wells Fargo & Company and Subsidiaries
Consolidated Statement of Cash Flows
Year ended December 31,
(in millions) 2009 2008 2007
Cash flows from operating activities:
Net income before noncontrolling interests $ 12,667 2,698 8,265
Adjustments to reconcile net income to net cash provided by operating activities:
Provision for credit losses 21,668 15,979 4,939
Changes in fair value of MSRs (residential), MHFS and LHFS carried at fair value (20) 3,789 2,611
Depreciation and amortization 2,841 1,669 1,532
Other net losses (gains) (3,867) 2,065 (1,407)
Preferred shares released to ESOP 106 451 418
Stock option compensation expense 221 174 129
Excess tax benefits related to stock option payments (18) (121) (196)
Originations of MHFS (414,299) (213,498) (223,266)
Proceeds from sales of and principal collected on mortgages originated for sale 399,261 220,254 216,270
Originations of LHFS (10,800) ——
Proceeds from sales of and principal collected on LHFS 20,276 ——
Purchases of LHFS (8,614) ——
Net change in:
Trading assets 13,983 (3,045) (3,388)
Deferred income taxes 9,453 (1,642) (31)
Accrued interest receivable (293) (2,676) (407)
Accrued interest payable (1,028) 1,634 (87)
Other assets, net (15,018) (21,578) (587)
Other accrued expenses and liabilities, net 2,094 (10,941) 4,491
Net cash provided (used) by operating activities 28,613 (4,788) 9,286
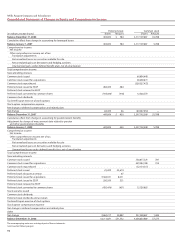
Cash flows from investing activities:
Net change in:
Federal funds sold, securities purchased under resale agreements
and other short-term investments 8,548 51,049 3,331
Securities available for sale:
Sales proceeds 53,038 60,806 47,990
Prepayments and maturities 38,811 24,317 8,505
Purchases (95,285) (105,341) (75,129)
Loans:
Decrease (increase) in banking subsidiaries’ loan originations, net of collections 52,240 (54,815) (48,615)
Proceeds from sales (including participations) of loans originated for investment
by banking subsidiaries 6,162 1,988 3,369
Purchases (including participations) of loans by banking subsidiaries (3,363) (5,513) (8,244)
Principal collected on nonbank entities’ loans 14,428 21,846 21,476
Loans originated by nonbank entities (9,961) (19,973) (25,284)
Net cash acquired from (paid for) acquisitions (138) 11,203 (2,811)
Proceeds from sales of foreclosed assets 3,759 1,746 1,405
Changes in MSRs from purchases and sales (10) 92 791
Other, net 3,556 (5,566) (4,131)
Net cash provided (used) by investing activities 71,785 (18,161) (77,347)
Cash flows from financing activities:
Net change in:
Deposits 42,473 7,697 27,058
Short-term borrowings (69,108) (14,888) 39,827
Long-term debt:
Proceeds from issuance 8,396 35,701 29,360
Repayment (66,260) (29,859) (18,250)
Preferred stock:
Proceeds from issuance —22,674 —
Redeemed (25,000) ——
Cash dividends paid (2,178) ——
Proceeds from issuance of stock warrant —2,326 —
Common stock:
Proceeds from issuance 21,976 14,171 1,876
Repurchased (220) (1,623) (7,418)
Cash dividends paid (2,125) (4,312) (3,955)
Excess tax benefits related to stock option payments 18 121 196
Change in noncontrolling interests:
Purchase of Prudential’s noncontrolling interest (4,500) ——
Other, net (553) (53) (176)
Other, net —— (728)
Net cash provided (used) by financing activities (97,081) 31,955 67,790
Net change in cash and due from banks 3,317 9,006 (271)
Cash and due from banks at beginning of year 23,763 14,757 15,028
Cash and due from banks at end of year $ 27,080 23,763 14,757
Supplemental cash flow disclosures:
Cash paid for interest $ 10,978 8,121 14,290
Cash paid for income taxes 3,042 2,554 3,719
The accompanying notes are an integral part of these statements. See Note 1 in this Report for noncash investing and financing activities.