Wells Fargo 2009 Annual Report Download - page 119
Download and view the complete annual report
Please find page 119 of the 2009 Wells Fargo annual report below. You can navigate through the pages in the report by either clicking on the pages listed below, or by using the keyword search tool below to find specific information within the annual report.-
 1
1 -
2
-
3
-
4
-
5
-
6
-
7
-
8
-
9
-
10
-
11
-
12
-
13
-
14
-
15
-
16
-
17
-
18
-
19
-
20
-
21
-
22
-
23
-
24
-
25
-
26
-
27
-
28
-
29
-
30
-
31
-
32
-
33
-
34
-
35
-
36
-
37
-
38
-
39
-
40
-
41
-
42
-
43
-
44
-
45
-
46
-
47
-
48
-
49
-
50
-
51
-
52
-
53
-
54
-
55
-
56
-
57
-
58
-
59
-
60
-
61
-
62
-
63
-
64
-
65
-
66
-
67
-
68
-
69
-
70
-
71
-
72
-
73
-
74
-
75
-
76
-
77
-
78
-
79
-
80
-
81
-
82
-
83
-
84
-
85
-
86
-
87
-
88
-
89
-
90
-
91
-
92
-
93
-
94
-
95
-
96
-
97
-
98
-
99
-
100
-
101
-
102
-
103
-
104
-
105
-
106
-
107
-
108
-
 109
109 -
 110
110 -
 111
111 -
 112
112 -
 113
113 -
 114
114 -
 115
115 -
 116
116 -
 117
117 -
 118
118 -
 119
119 -
 120
120 -
 121
121 -
 122
122 -
 123
123 -
 124
124 -
 125
125 -
 126
126 -
 127
127 -
 128
128 -
 129
129 -
130
-
131
-
132
-
133
-
134
-
135
-
136
-
137
-
138
-
139
-
140
-
141
-
142
-
143
-
144
-
145
-
146
-
147
-
148
-
149
-
150
-
151
-
152
-
153
-
154
-
155
-
156
-
157
-
158
-
159
-
160
-
161
-
162
-
163
-
164
-
165
-
166
-
167
-
168
-
169
-
170
-
171
-
172
-
173
-
174
-
175
-
176
-
177
-
178
-
179
-
180
-
181
-
182
-
183
-
184
-
185
-
186
-
187
-
188
-
189
-
190
-
191
-
192
-
193
-
194
-
195
-
196
 |
 |

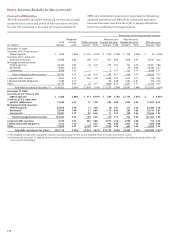
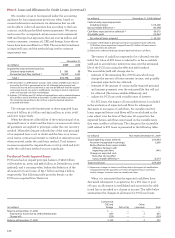
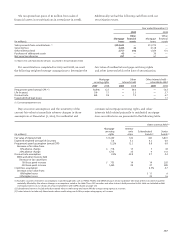
Non-agency residential MBS –
non-investment grade (1)
Year ended December 31, 2009
Expected remaining life of loan losses (2):
Range (3) 0-58%
Credit impairment distribution (4):
0-10% range 56
10-20% range 27
20-30% range 12
Greater than 30% 5
Weighted average (5) 11
Current subordination levels (6):
Range (3) 0-44
Weighted average (5) 8
Prepayment speed (annual CPR (7)):
Range (3) 5-25
Weighted average (5) 11
(1) Total credit impairment losses were $591 million, of which 96% were recorded
on non-investment grade securities for the year ended December 31, 2009.
This does not include OTTI recorded on those securities that we intend to sell.
(2) Represents future expected credit losses on underlying pool of loans
expressed as a percentage of total current outstanding loan balance.
(3) Represents the range of inputs/assumptions based upon the individual
securities within each category.
(4) Represents distribution of credit impairment losses recognized in earnings
categorized based on range of expected remaining life of loan losses.
For example, 56% of credit impairment losses recognized in earnings for the
year ended December 31, 2009, had expected remaining life of loan loss
assumptions of 0 to 10%.
(5) Calculated by weighting the relevant input/assumption for each individual
security by current outstanding amortized cost basis of the security.
(6) Represents current level of credit protection (subordination) for the securities,
expressed as a percentage of total current underlying loan balance.
(7) Constant prepayment rate.
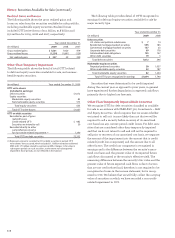
(in millions) Year ended December 31, 2009
Balance, beginning of year $ 471
Additions (1):
Initial credit impairments 625
Subsequent credit impairments 357
Reductions:
For securities sold (255)
Due to change in intent to sell
or requirement to sell (1)
For increases in expected cash flows (10)
Balance, end of year $1,187
(1) Excludes $30 million of OTTI on debt securities we intend to sell.
For asset-backed securities (e.g., residential MBS), we esti -
mated expected future cash flows of the security by estimating
the expected future cash flows of the underlying collateral
and applying those collateral cash flows, together with any
credit enhancements such as subordinated interests owned
by third parties, to the security. The expected future cash
flows of the underlying collateral are determined using the
remaining contractual cash flows adjusted for future expected
credit losses (which considers current delinquencies and non-
performing assets, future expected default rates and collateral
value by vintage and geographic region) and prepayments.
The expected cash flows of the security are then discounted
at the interest rate used to recognize interest income on the
security to arrive at a present value amount. The table below
presents a summary of the significant inputs considered in
determining the measurement of the credit loss component
recognized in earnings for residential MBS.
The table below presents a roll-forward of the credit loss
component recognized in earnings (referred to as “credit-
impaired” debt securities). The credit loss component of the
amortized cost represents the difference between the present
value of expected future cash flows and the amortized cost
basis of the security prior to considering credit losses. The
beginning balance represents the credit loss component for
debt securities for which OTTI occurred prior to January 1,
2009. OTTI recognized in earnings in 2009 for credit-impaired
debt securities is presented as additions in two components
based upon whether the current period is the first time the
debt security was credit-impaired (initial credit impairment)
or is not the first time the debt security was credit impaired
(subsequent credit impairments). The credit loss component is
reduced if we sell, intend to sell or believe we will be required
to sell previously credit-impaired debt securities. Additionally,
the credit loss component is reduced if we receive or expect
to receive cash flows in excess of what we previously expected
to receive over the remaining life of the credit-impaired
debt security, the security matures or is fully written down.
Changes in the credit loss component of credit-impaired
debt securities were: