Wells Fargo 2009 Annual Report Download - page 39
Download and view the complete annual report
Please find page 39 of the 2009 Wells Fargo annual report below. You can navigate through the pages in the report by either clicking on the pages listed below, or by using the keyword search tool below to find specific information within the annual report.-
 1
1 -
2
-
3
-
4
-
5
-
6
-
7
-
8
-
9
-
10
-
11
-
12
-
13
-
14
-
15
-
16
-
17
-
18
-
19
-
20
-
21
-
22
-
23
-
24
-
25
-
26
-
27
-
28
-
 29
29 -
 30
30 -
 31
31 -
 32
32 -
 33
33 -
 34
34 -
 35
35 -
 36
36 -
 37
37 -
 38
38 -
 39
39 -
 40
40 -
 41
41 -
 42
42 -
 43
43 -
 44
44 -
 45
45 -
 46
46 -
 47
47 -
 48
48 -
 49
49 -
50
-
51
-
52
-
53
-
54
-
55
-
56
-
57
-
58
-
59
-
60
-
61
-
62
-
63
-
64
-
65
-
66
-
67
-
68
-
69
-
70
-
71
-
72
-
73
-
74
-
75
-
76
-
77
-
78
-
79
-
80
-
81
-
82
-
83
-
84
-
85
-
86
-
87
-
88
-
89
-
90
-
91
-
92
-
93
-
94
-
95
-
96
-
97
-
98
-
99
-
100
-
101
-
102
-
103
-
104
-
105
-
106
-
107
-
108
-
109
-
110
-
111
-
112
-
113
-
114
-
115
-
116
-
117
-
118
-
119
-
120
-
121
-
122
-
123
-
124
-
125
-
126
-
127
-
128
-
129
-
130
-
131
-
132
-
133
-
134
-
135
-
136
-
137
-
138
-
139
-
140
-
141
-
142
-
143
-
144
-
145
-
146
-
147
-
148
-
149
-
150
-
151
-
152
-
153
-
154
-
155
-
156
-
157
-
158
-
159
-
160
-
161
-
162
-
163
-
164
-
165
-
166
-
167
-
168
-
169
-
170
-
171
-
172
-
173
-
174
-
175
-
176
-
177
-
178
-
179
-
180
-
181
-
182
-
183
-
184
-
185
-
186
-
187
-
188
-
189
-
190
-
191
-
192
-
193
-
194
-
195
-
196
 |
 |

Earnings Performance
The earnings performance in 2009 was impacted by the
acquisition of Wachovia on December 31, 2008, which signifi-
cantly increased both asset size and the earnings potential of
the Company. Net income for 2009 was $12.3 billion ($1.75
diluted per share) with $8.0 billion applicable to common
stock, compared with net income of $2.7 billion ($0.70 diluted
per share) with $2.4 billion applicable to common stock for 2008.
Our 2009 earnings were influenced by factors including:
•a low mortgage rate environment combined with synergies
from the addition of complementary Wachovia business
lines, which resulted in a more even split in revenue
between net interest income and noninterest income, pri-
marily mortgage banking and trust and investment fees;
•the integration of Wachovia, which increased our expenses
to align staffing models with those of Wells Fargo in our
service and product distribution channels, as well as to
align or enhance our various systems, business line
support and other infrastructures;
•consumer and commercial borrower financial distress,
which increased credit losses and foreclosed asset
preservation costs, as well as increased staffing expenses
to manage loan modification programs, loan collection,
and various other loss mitigation activities; and
•significant distress in the financial services industry,
which caused, among other items, increased Federal
Deposit Insurance Corporation (FDIC) and other
deposit assessments.
Revenue, the sum of net interest income and noninterest
income, grew to $88.7 billion in 2009 from $41.9 billion in 2008,
primarily due to the acquisition of Wachovia. In 2009, net
interest income of $46.3 billion represented 52% of revenue,
compared with $25.1 billion (60%) in 2008. Noninterest income
of $42.4 billion in 2009 represented 48% of revenue, up from
$16.7 billion (40%) in 2008. The increase in noninterest income
as a percentage of revenue was due to a higher percentage of
trust and investment fees (11% in 2009, up from 7% in 2008)
with the addition of Wells Fargo Advisors (formerly Wachovia
Securities) retail brokerage business, legacy Wachovia wealth
management and retirement, and reinsurance businesses, and
to very strong mortgage banking results (14% in 2009, up
from 6% in 2008, predominantly from legacy Wells Fargo).
Noninterest expense as a percentage of revenue was 55%
in 2009 and 54% in 2008, with amortization of core deposits
(3% of revenue in 2009 and less than 1% in 2008) and additional
FDIC and other deposit assessments (2% of revenue in 2009
and less than 1% in 2008) in 2009 driving the slightly weaker
ratio. Noninterest expense for 2009 also included $895 million
of Wachovia merger-related integration expense.
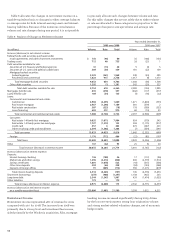
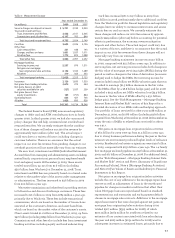
Table 3 presents the components of revenue and noninterest
expense as a percentage of revenue for year-over-year results,
comparing the combined Wells Fargo and Wachovia results
for 2009 with legacy Wells Fargo results for 2008.
Net Interest Income
Net interest income is the interest earned on debt securities,
loans (including yield-related loan fees) and other interest-
earning assets minus the interest paid for deposits, short-term
borrowings and long-term debt. The net interest margin is the
average yield on earning assets minus the average interest
rate paid for deposits and our other sources of funding. Net
interest income and the net interest margin are presented on
a taxable-equivalent basis in Table 5 to consistently reflect
income from taxable and tax-exempt loans and securities
based on a 35% federal statutory tax rate.
Net interest income on a taxable-equivalent basis
increased to $47.0 billion in 2009, from $25.4 billion in 2008,
and the net interest margin was 4.28% in 2009, down 55 basis
points from 4.83% in 2008. These changes are primarily due to
the impact of acquiring Wachovia. Although the addition of
Wachovia increased earning assets and net interest income, it
decreased the net interest margin since Wachovia’s net inter-
est margin was much lower than that of legacy Wells Fargo.
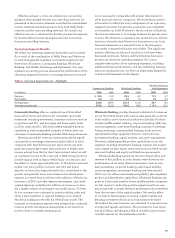
Table 4 presents the components of earning assets and
funding sources as a percentage of earning assets to provide
a more meaningful analysis of year-over-year average bal-
ances, comparing the combined Wells Fargo and Wachovia
balances for 2009 with legacy Wells Fargo balances for 2008.
The mix of earning assets and their yields are important
drivers of net interest income. During 2009, there were slight
shifts in our earning asset mix from loans to more liquid
assets. Due to weaker loan demand in 2009 and the impact
of liquidating certain loan portfolios, average loans for 2009
decreased to 75% of average earning assets from 76% for 2008,
average mortgage-backed securities (MBS) dropped to 12% in
2009, from 13% in 2008, and average short-term investments
and trading account assets increased to 2% in 2009 from 1% a
year ago.
As a result of PCI loan accounting, certain credit-related
ratios of the Company, including the growth rate in nonper-
forming assets (NPAs) since December 31, 2008, may not be
directly comparable with periods prior to the merger or with
credit-related ratios of other financial institutions. In particular:
• Wachovia’s high risk loans were written down pursuant
to PCI accounting at the time of merger. Therefore, the
allowance for credit losses is lower than otherwise would
have been required without PCI loan accounting; and
• Because we virtually eliminated Wachovia’s nonaccrual
loans at December 31, 2008, quarterly growth in our nonac-
crual loans during 2009 was higher than it would have been
without PCI loan accounting. Similarly, our net charge-offs
rate was lower than it otherwise would have been.
For further detail on the merger see the “Balance Sheet
Analysis – Loan Portfolio” section and Note 2 (Business
Combinations) to Financial Statements in this Report.