Wells Fargo 2009 Annual Report Download - page 40
Download and view the complete annual report
Please find page 40 of the 2009 Wells Fargo annual report below. You can navigate through the pages in the report by either clicking on the pages listed below, or by using the keyword search tool below to find specific information within the annual report.-
 1
1 -
2
-
3
-
4
-
5
-
6
-
7
-
8
-
9
-
10
-
11
-
12
-
13
-
14
-
15
-
16
-
17
-
18
-
19
-
20
-
21
-
22
-
23
-
24
-
25
-
26
-
27
-
28
-
29
-
 30
30 -
 31
31 -
 32
32 -
 33
33 -
 34
34 -
 35
35 -
 36
36 -
 37
37 -
 38
38 -
 39
39 -
 40
40 -
 41
41 -
 42
42 -
 43
43 -
 44
44 -
 45
45 -
 46
46 -
 47
47 -
 48
48 -
 49
49 -
 50
50 -
51
-
52
-
53
-
54
-
55
-
56
-
57
-
58
-
59
-
60
-
61
-
62
-
63
-
64
-
65
-
66
-
67
-
68
-
69
-
70
-
71
-
72
-
73
-
74
-
75
-
76
-
77
-
78
-
79
-
80
-
81
-
82
-
83
-
84
-
85
-
86
-
87
-
88
-
89
-
90
-
91
-
92
-
93
-
94
-
95
-
96
-
97
-
98
-
99
-
100
-
101
-
102
-
103
-
104
-
105
-
106
-
107
-
108
-
109
-
110
-
111
-
112
-
113
-
114
-
115
-
116
-
117
-
118
-
119
-
120
-
121
-
122
-
123
-
124
-
125
-
126
-
127
-
128
-
129
-
130
-
131
-
132
-
133
-
134
-
135
-
136
-
137
-
138
-
139
-
140
-
141
-
142
-
143
-
144
-
145
-
146
-
147
-
148
-
149
-
150
-
151
-
152
-
153
-
154
-
155
-
156
-
157
-
158
-
159
-
160
-
161
-
162
-
163
-
164
-
165
-
166
-
167
-
168
-
169
-
170
-
171
-
172
-
173
-
174
-
175
-
176
-
177
-
178
-
179
-
180
-
181
-
182
-
183
-
184
-
185
-
186
-
187
-
188
-
189
-
190
-
191
-
192
-
193
-
194
-
195
-
196
 |
 |

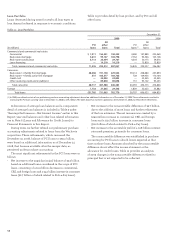
Average interest-bearing core deposits increased to 58%
of average earning assets for 2009, from 51% for 2008, and
average short-term borrowings decreased to 5% of average
earning assets, from 13% for 2008. Core deposits are a low-
cost source of funding and thus an important contributor to
growth in net interest income and the net interest margin.
Core deposits include noninterest-bearing deposits, interest-
bearing checking, savings certificates, market rate and other
savings, and certain foreign deposits (Eurodollar sweep
balances). Average core deposits rose to $762.5 billion in 2009
from $325.2 billion in 2008 and funded 93% and 82% of average
loans, respectively. About 87% of our core deposits are now in
checking and savings deposits, one of the highest percentages
in the industry. Total average retail core deposits, which
exclude Wholesale Banking core deposits and retail mort-
gage escrow deposits, grew to $588.1 billion for 2009 from
$234.1 billion a year ago. Average mortgage escrow deposits
were $28.3 billion for 2009, compared with $21.0 billion a year
ago. Average savings certificates increased to $140.2 billion
in 2009 from $39.5 billion a year ago and average checking
and savings deposits increased to $622.4 billion in 2009 from
$285.7 billion a year ago. Total average interest-bearing deposits
increased to $635.9 billion in 2009 from $266.1 billion a
year ago.
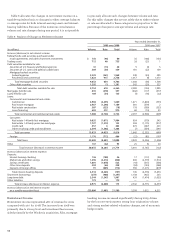
Table 5 presents the individual components of net interest
income and the net interest margin.
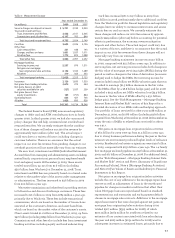
Table 3: Net Interest Income, Noninterest Income and Noninterest Expense as a Percentage of Revenue
Year ended December 31,
% of % of
(in millions, except per share amounts) 2009 revenue 2008 revenue
Interest income
Trading assets $ 944 1% $ 189 —%
Securities available for sale 11,941 13 5,577 13
Mortgages held for sale 1,930 2 1,573 4
Loans held for sale 183 — 48 —
Loans 41,659 47 27,651 66
Other interest income 336 — 181 —
Total interest income 56,993 64 35,219 84
Interest expense
Deposits 3,774 4 4,521 11
Short-term borrowings 231 — 1,478 4
Long-term debt 5,786 7 3,789 9
Other interest expense 172 — — —
Total interest expense 9,963 11 9,788 23
Net interest income (on a taxable-equivalent basis) 47,030 53 25,431 61
Taxable-equivalent adjustment (706) (1) (288)(1)
Net interest income 46,324 52 25,143 60
Noninterest income
Service charges on deposit accounts 5,741 6 3,190 8
Trust and investment fees 9,735 11 2,924 7
Card fees 3,683 4 2,336 6
Other fees 3,804 4 2,097 5
Mortgage banking 12,028 14 2,525 6
Insurance 2,126 2 1,830 4
Net gains from trading activities 2,674 3 275 1
Net gains (losses) on debt securities available for sale (127) — 1,037 2
Net gains (losses) from equity investments 185 — (757) (2)
Operating leases 685 1 427 1
Other 1,828 2 850 2
Total noninterest income 42,362 48 16,734 40
Noninterest expense
Salaries 13,757 16 8,260 20
Commission and incentive compensation 8,021 9 2,676 6
Employee benefits 4,689 5 2,004 5
Equipment 2,506 3 1,357 3
Net occupancy 3,127 4 1,619 4
Core deposit and other intangibles 2,577 3 186 —
FDIC and other deposit assessments 1,849 2 120 —
Other (1) 12,494 14 6,376 15
Total noninterest expense 49,020 55 22,598 54
Revenue $88,686 41,877
(1) See Table 8 – Noninterest Expense in this Report for additional detail.