Wells Fargo 2009 Annual Report Download - page 181
Download and view the complete annual report
Please find page 181 of the 2009 Wells Fargo annual report below. You can navigate through the pages in the report by either clicking on the pages listed below, or by using the keyword search tool below to find specific information within the annual report.
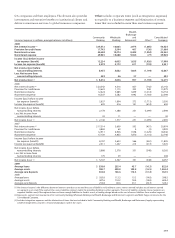
Wealth,
Brokerage
Community Wholesale and Consolidated
(income/expense in millions, average balances in billions) Banking Banking Retirement Other(3) Company
2009
Net interest income (1) $34,372 10,063 2,974 (1,085) 46,324
Provision for credit losses 17,743 3,594 467 (136) 21,668
Noninterest income 24,650 10,274 8,492 (1,054) 42,362
Noninterest expense 29,045 10,688 9,364 (77) 49,020
Income (loss) before income
tax expense (benefit) 12,234 6,055 1,635 (1,926) 17,998
Income tax expense (benefit) 3,279 2,173 611 (732) 5,331
Net income (loss) before
noncontrolling interests 8,955 3,882 1,024 (1,194) 12,667
Less: Net income from
noncontrolling interests 339 26 27 — 392
Net income (loss) (2) $ 8,616 3,856 997 (1,194) 12,275
2008
Net interest income (1) $ 20,542 4,516 827 (742) 25,143
Provision for credit losses 13,622 1,115 302 940 15,979
Noninterest income 12,424 3,685 1,839 (1,214) 16,734
Noninterest expense 16,507 5,282 1,992 (1,183) 22,598
Income (loss) before income
tax expense (benefit) 2,837 1,804 372 (1,713) 3,300
Income tax expense (benefit) 659 416 141 (614) 602
Net income (loss) before
noncontrolling interests 2,178 1,388 231 (1,099) 2,698
Less: Net income from
noncontrolling interests 32 11 — — 43
Net income (loss) (2) $ 2,146 1,377 231 (1,099) 2,655
2007
Net interest income (1) $ 17,314 3,609 502 (451) 20,974
Provision for credit losses 4,869 69 4 (3) 4,939
Noninterest income 12,911 4,926 1,938 (1,229) 18,546
Noninterest expense 17,159 4,833 1,870 (1,116) 22,746
Income (loss) before income
tax expense (benefit) 8,197 3,633 566 (561) 11,835
Income tax expense (benefit) 2,311 1,257 215 (213) 3,570
Net income (loss) before
noncontrolling interests 5,886 2,376 351 (348) 8,265
Less: Net income from
noncontrolling interests 179 29 — — 208
Net income (loss) (2) $ 5,707 2,347 351 (348) 8,057
2009
Average loans $ 538.0 255.4 45.7 (16.3) 822.8
Average assets 788.7 380.8 109.4 (16.5) 1,262.4
Average core deposits 533.0 146.6 114.3 (31.4) 762.5
2008
Average loans $ 285.6 112.3 15.2 (14.6) 398.5
Average assets 447.6 153.2 18.4 (14.8) 604.4
Average core deposits 252.8 69.6 23.1 (20.3) 325.2
(1) Net interest income is the difference between interest earned on assets and the cost of liabilities to fund those assets. Interest earned includes actual interest earned
on segment assets and, if the segment has excess liabilities, interest credits for providing funding to other segments. The cost of liabilities includes interest expense on
segment liabilities and, if the segment does not have enough liabilities to fund its assets, a funding charge based on the cost of excess liabilities from another segment.
(2) Represents segment net income (loss) for Community Banking; Wholesale Banking; and Wealth, Brokerage and Retirement segments and Wells Fargo net income for the
Consolidated Company.
(3) Includes integration expenses and the elimination of items that are included in both Community Banking and Wealth, Brokerage and Retirement, largely representing
wealth management customers serviced and products sold in the stores.
U.S. companies and their employees. The division also provides
investments and executive benefits to institutional clients and
delivers reinsurance services to global insurance companies.
Other includes corporate items (such as integration expenses)
not specific to a business segment and elimination of certain
items that are included in more than one business segment.


