Wells Fargo 2009 Annual Report Download - page 172
Download and view the complete annual report
Please find page 172 of the 2009 Wells Fargo annual report below. You can navigate through the pages in the report by either clicking on the pages listed below, or by using the keyword search tool below to find specific information within the annual report.-
 1
1 -
2
-
3
-
4
-
5
-
6
-
7
-
8
-
9
-
10
-
11
-
12
-
13
-
14
-
15
-
16
-
17
-
18
-
19
-
20
-
21
-
22
-
23
-
24
-
25
-
26
-
27
-
28
-
29
-
30
-
31
-
32
-
33
-
34
-
35
-
36
-
37
-
38
-
39
-
40
-
41
-
42
-
43
-
44
-
45
-
46
-
47
-
48
-
49
-
50
-
51
-
52
-
53
-
54
-
55
-
56
-
57
-
58
-
59
-
60
-
61
-
62
-
63
-
64
-
65
-
66
-
67
-
68
-
69
-
70
-
71
-
72
-
73
-
74
-
75
-
76
-
77
-
78
-
79
-
80
-
81
-
82
-
83
-
84
-
85
-
86
-
87
-
88
-
89
-
90
-
91
-
92
-
93
-
94
-
95
-
96
-
97
-
98
-
99
-
100
-
101
-
102
-
103
-
104
-
105
-
106
-
107
-
108
-
109
-
110
-
111
-
112
-
113
-
114
-
115
-
116
-
117
-
118
-
119
-
120
-
121
-
122
-
123
-
124
-
125
-
126
-
127
-
128
-
129
-
130
-
131
-
132
-
133
-
134
-
135
-
136
-
137
-
138
-
139
-
140
-
141
-
142
-
143
-
144
-
145
-
146
-
147
-
148
-
149
-
150
-
151
-
152
-
153
-
154
-
155
-
156
-
157
-
158
-
159
-
160
-
161
-
 162
162 -
 163
163 -
 164
164 -
 165
165 -
 166
166 -
 167
167 -
 168
168 -
 169
169 -
 170
170 -
 171
171 -
 172
172 -
 173
173 -
 174
174 -
 175
175 -
 176
176 -
 177
177 -
 178
178 -
 179
179 -
 180
180 -
 181
181 -
 182
182 -
183
-
184
-
185
-
186
-
187
-
188
-
189
-
190
-
191
-
192
-
193
-
194
-
195
-
196
 |
 |

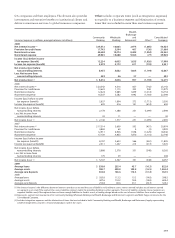
December 31,
2009 2008 2007
Pension Other Pension Other Pension Other
benefits(1) benefits benefits(1) benefits benefits (1) benefits
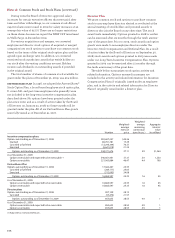
Discount rate (2) 7.42% 6.75 6.25 6.25 5.75 5.75
Expected return on plan assets 8.75 8.75 8.75 8.75 8.75 8.75
Rate of compensation increase 4.0 — 4.0 — 4.0 —
(1) Includes both qualified and nonqualified pension benefits.
(2) Due to the freeze of the Wells Fargo qualified and supplemental Cash Balance Plans and the Wachovia Corporation Pension Plan, the discount rate for the 2009 Pension
benefits was the weighted average of 6.75% from January through April and 7.75% from May through December.
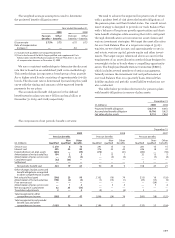
The weighted-average assumptions used to determine the net periodic benefit cost were:
Our determination of the reasonableness of our expected
long-term rate of return on plan assets is highly quantitative
by nature. We evaluate the current asset allocations and
expected returns under two sets of conditions: projected
returns using several forward-looking capital market assump-
tions, and historical returns for the main asset classes dating
back to 1970, the earliest period for which historical data was
readily available as of a common time frame for the asset
classes included. Using data dating back to 1970 allows us
to capture multiple economic environments, which we believe
is relevant when using historical returns. We place greater
emphasis on the forward looking return and risk assumptions
than on historical results. We use the resulting projections to
derive a base line expected rate of return and risk level for the
Cash Balance Plans’ prescribed asset mix. We then adjust the
baseline projected returns for items not already captured,
including the anticipated return differential from active over
passive investment management and the estimated impact
of an asset allocation methodology that allows for established
deviations from the specified target allocations when a com-
pelling opportunity exists.
We evaluate the portfolio based on: (1) the established
target asset allocations over short term (one-year) and
longer term (ten-year) investment horizons, and (2) the range
of potential outcomes over these horizons within specific
standard deviations. We perform the above analyses to assess
the reasonableness of our expected long-term rate of return
on plan assets. We consider the expected rate of return
to be a long-term average view of expected returns. The
expected rate of return would be assessed for significant
long-term changes in economic conditions or in planned
portfolio composition.
To account for postretirement health care plans we use
health care cost trend rates to recognize the effect of expected
changes in future health care costs due to medical inflation,
utilization changes, new technology, regulatory requirements
and Medicare cost shifting. We assumed average annual
increases of approximately 9.5% (before age 65) and 9% (after
age 65) for health care costs for 2010. The rates of average
annual increases are assumed to trend down 0.5% each year
until the trend rates reach an ultimate trend of 5% in 2017
(before age 65) and 2016 (after age 65). Increasing the
assumed health care trend by one percentage point in each
year would increase the benefit obligation as of December 31,
2009, by $71 million and the total of the interest cost and
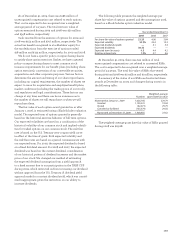
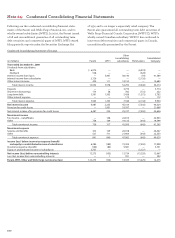
Pension benefits
Non- Other
(in millions) Qualified qualified benefits
Year ended December 31,
2010 $ 818 81 118
2011 796 78 121
2012 778 65 123
2013 779 59 125
2014 772 61 127
2015-2019 3,610 267 627
Other benefits
(in millions) subsidy receipts
Year ended December 31,
2010 $17
2011 18
2012 19
2013 20
2014 21
2015-2019 65
Note 19: Employee Benefits and Other Expenses (continued)
service cost components of the net periodic benefit cost for
2009 by $5 million. Decreasing the assumed health care trend
by one percentage point in each year would decrease the
benefit obligation as of December 31, 2009, by $63 million
and the total of the interest cost and service cost components
of the net periodic benefit cost for 2009 by $4 million.
The investment strategy for assets held in the Retiree
Medical Plan Voluntary Employees’ Beneficiary Association
(VEBA) trust is established separately from the strategy for
the assets in the Cash Balance Plan. The general target asset
mix is 45-65% equities and 35-55% fixed income. In addition,
the strategy for the VEBA trust assets considers the effect of
income taxes by utilizing a combination of variable annuity
and low turnover investment strategies. Members of the
EBRC formally review the investment risk and performance
of these assets on a quarterly basis.
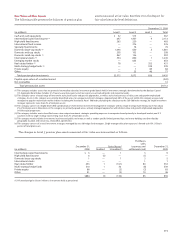
Future benefits that we expect to pay under the pension
and other benefit plans are presented in the following table.
Other benefits payments are expected to be reduced by
prescription drug subsidies from the federal government
provided by the Medicare Prescription Drug, Improvement
and Modernization Act of 2003, as follows: