Wells Fargo 2009 Annual Report Download - page 160
Download and view the complete annual report
Please find page 160 of the 2009 Wells Fargo annual report below. You can navigate through the pages in the report by either clicking on the pages listed below, or by using the keyword search tool below to find specific information within the annual report.-
 1
1 -
2
-
3
-
4
-
5
-
6
-
7
-
8
-
9
-
10
-
11
-
12
-
13
-
14
-
15
-
16
-
17
-
18
-
19
-
20
-
21
-
22
-
23
-
24
-
25
-
26
-
27
-
28
-
29
-
30
-
31
-
32
-
33
-
34
-
35
-
36
-
37
-
38
-
39
-
40
-
41
-
42
-
43
-
44
-
45
-
46
-
47
-
48
-
49
-
50
-
51
-
52
-
53
-
54
-
55
-
56
-
57
-
58
-
59
-
60
-
61
-
62
-
63
-
64
-
65
-
66
-
67
-
68
-
69
-
70
-
71
-
72
-
73
-
74
-
75
-
76
-
77
-
78
-
79
-
80
-
81
-
82
-
83
-
84
-
85
-
86
-
87
-
88
-
89
-
90
-
91
-
92
-
93
-
94
-
95
-
96
-
97
-
98
-
99
-
100
-
101
-
102
-
103
-
104
-
105
-
106
-
107
-
108
-
109
-
110
-
111
-
112
-
113
-
114
-
115
-
116
-
117
-
118
-
119
-
120
-
121
-
122
-
123
-
124
-
125
-
126
-
127
-
128
-
129
-
130
-
131
-
132
-
133
-
134
-
135
-
136
-
137
-
138
-
139
-
140
-
141
-
142
-
143
-
144
-
145
-
146
-
147
-
148
-
149
-
 150
150 -
 151
151 -
 152
152 -
 153
153 -
 154
154 -
 155
155 -
 156
156 -
 157
157 -
 158
158 -
 159
159 -
 160
160 -
 161
161 -
 162
162 -
 163
163 -
 164
164 -
 165
165 -
 166
166 -
 167
167 -
 168
168 -
 169
169 -
 170
170 -
171
-
172
-
173
-
174
-
175
-
176
-
177
-
178
-
179
-
180
-
181
-
182
-
183
-
184
-
185
-
186
-
187
-
188
-
189
-
190
-
191
-
192
-
193
-
194
-
195
-
196
 |
 |

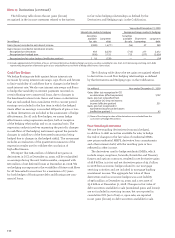
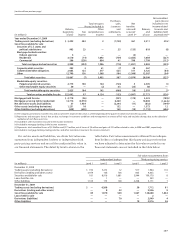
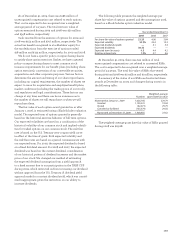
Carrying value at year end
(in millions) Level 1Level 2Level 3 Total
December 31, 2008
Mortgages held for sale $ — 521 534 1,055
Loans held for sale — 338 — 338
Loans (1) — 1,487 107 1,594
Private equity investments 134 — 18 152
Foreclosed assets (2) — 274 55 329
Operating lease assets — 186 — 186
December 31, 2009
Mortgages held for sale $ — 1,105 711 1,816
Loans held for sale — 444 — 444
Loans (1) — 6,177 134 6,311
Private equity investments — — 52 52
Foreclosed assets (2) — 199 38 237
Operating lease assets — 90 29 119
(1) Represents carrying value of loans for which adjustments are based on the appraised value of the collateral. The carrying value of loans fully charged-off, which includes
unsecured lines and loans, is zero.
(2) Represents the fair value of foreclosed real estate and other collateral owned that were measured at fair value subsequent to their initial classification as foreclosed assets.
Year ended December 31,
(in millions) 2009 2008
Mortgages held for sale $ (22) (28)
Loans held for sale 158 (105)
Loans (1) (13,083) (6,400)
Private equity investments (112) (81)
Foreclosed assets (2) (91) (165)
Operating lease assets (14) (28)
Total $(13,164) (6,807)
(1) Represents write-downs of loans based on the appraised value of the collateral.
(2) Represents the losses on foreclosed real estate and other collateral owned that were measured at fair value subsequent to their initial classification as foreclosed assets.
Assets and Liabilities Recorded at Fair Value on a
Nonrecurring Basis
We may be required, from time to time, to measure certain
assets at fair value on a nonrecurring basis in accordance
with GAAP. These adjustments to fair value usually result
from application of lower-of-cost-or-market accounting
Note 16: Fair Values of Assets and Liabilities (continued)
or write-downs of individual assets. For assets measured
at fair value on a nonrecurring basis in 2009 and 2008 that
were still held in the balance sheet at each respective year
end, the following table provides the fair value hierarchy
and the carrying value of the related individual assets or
portfolios at year end.
The following table presents the increase (decrease)
in value of certain assets that are measured at fair value on
a nonrecurring basis for which a fair value adjustment has
been included in the income statement, relating to assets
held at period end.