Wells Fargo 2009 Annual Report Download - page 49
Download and view the complete annual report
Please find page 49 of the 2009 Wells Fargo annual report below. You can navigate through the pages in the report by either clicking on the pages listed below, or by using the keyword search tool below to find specific information within the annual report.-
 1
1 -
2
-
3
-
4
-
5
-
6
-
7
-
8
-
9
-
10
-
11
-
12
-
13
-
14
-
15
-
16
-
17
-
18
-
19
-
20
-
21
-
22
-
23
-
24
-
25
-
26
-
27
-
28
-
29
-
30
-
31
-
32
-
33
-
34
-
35
-
36
-
37
-
38
-
 39
39 -
 40
40 -
 41
41 -
 42
42 -
 43
43 -
 44
44 -
 45
45 -
 46
46 -
 47
47 -
 48
48 -
 49
49 -
 50
50 -
 51
51 -
 52
52 -
 53
53 -
 54
54 -
 55
55 -
 56
56 -
 57
57 -
 58
58 -
 59
59 -
60
-
61
-
62
-
63
-
64
-
65
-
66
-
67
-
68
-
69
-
70
-
71
-
72
-
73
-
74
-
75
-
76
-
77
-
78
-
79
-
80
-
81
-
82
-
83
-
84
-
85
-
86
-
87
-
88
-
89
-
90
-
91
-
92
-
93
-
94
-
95
-
96
-
97
-
98
-
99
-
100
-
101
-
102
-
103
-
104
-
105
-
106
-
107
-
108
-
109
-
110
-
111
-
112
-
113
-
114
-
115
-
116
-
117
-
118
-
119
-
120
-
121
-
122
-
123
-
124
-
125
-
126
-
127
-
128
-
129
-
130
-
131
-
132
-
133
-
134
-
135
-
136
-
137
-
138
-
139
-
140
-
141
-
142
-
143
-
144
-
145
-
146
-
147
-
148
-
149
-
150
-
151
-
152
-
153
-
154
-
155
-
156
-
157
-
158
-
159
-
160
-
161
-
162
-
163
-
164
-
165
-
166
-
167
-
168
-
169
-
170
-
171
-
172
-
173
-
174
-
175
-
176
-
177
-
178
-
179
-
180
-
181
-
182
-
183
-
184
-
185
-
186
-
187
-
188
-
189
-
190
-
191
-
192
-
193
-
194
-
195
-
196
 |
 |

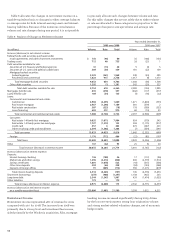
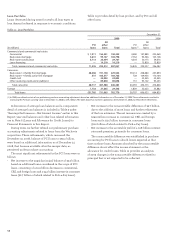
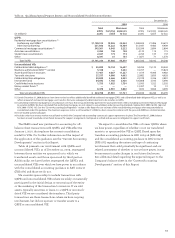
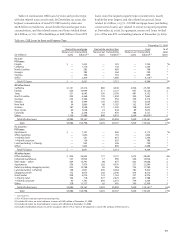
During 2009, we continued to grow core deposits even
though loan demand remained soft. Deposits increased
$42.6 billion in 2009 from a year ago, with $35.3 billion of the
increase in core deposits. Growth in deposits was due to the
increase in the U.S. money supply, a preference on the part
of consumers and businesses to maintain liquidity, and the
Company’s successful efforts to attract and retain deposits
from new and existing customers. Loans decreased $82.1 billion
from a year ago, before considering the impact of the $3.5 billion
increase in the allowance for loan losses. Commercial loan
demand was soft during 2009 as businesses reduced investing
in inventory, plant and equipment. Likewise, retail customer
borrowing declined as consumers limited their spending.
Excess deposits were therefore invested in liquid assets,
particularly in the latter half of 2009. Our rate mix of core
deposits improved with noninterest-bearing, interest-bearing
checking, and market rate and other lower cost savings deposits
increasing to 83% of total core deposits at December 31, 2009,
from 71% a year ago.
See the following sections for more discussion and details
about the major components of our balance sheet. Capital is
discussed in the “Capital Management” section of this Report.
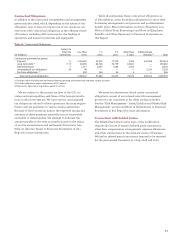
Securities Available for Sale
Securities available for sale consist of both debt and marketable
equity securities. We hold debt securities available for sale
primarily for liquidity, interest rate risk management and
long-term yield enhancement. Accordingly, this portfolio
consists primarily of very liquid, high-quality federal agency
debt and privately issued MBS. We held $167.1 billion of debt
securities available for sale, with net unrealized gains of
$4.8 billion, at December 31, 2009, compared with $145.4 billion,
with net unrealized losses of $9.8 billion a year ago. We also
held $5.6 billion of marketable equity securities available for
sale, with net unrealized gains of $843 million, at December 31,
2009, compared with $6.1 billion, with net unrealized losses
of $160 million a year ago. The total net unrealized gains on
securities available for sale were $5.6 billion at December 31,
2009, up from net unrealized losses of $9.9 billion at December 31,
2008, due to general decline in long-term yields and narrowing
of credit spreads. With the application of purchase accounting
at December 31, 2008, for the Wachovia portfolio, the net
unrealized losses in cumulative other comprehensive income
(OCI), a component of common equity, related entirely to
the legacy Wells Fargo portfolio at that date.
We analyze securities for OTTI on a quarterly basis, or
more often if a potential loss-triggering event occurs. Of the
$1.7 billion OTTI write-downs in 2009, $1.0 billion related to
debt securities and $655 million to equity securities. For a dis-
cussion of our OTTI accounting policies and underlying con-
siderations and analysis see Note 1 (Summary of Significant
Accounting Policies – Accounting Standards Adopted in 2009
– FASB ASC 320-10 and – Securities) and Note 5 (Securities
Available for Sale) to Financial Statements in this Report.
At December 31, 2009, we had approximately $8 billion of
investments in securities, primarily municipal bonds, which
are guaranteed against loss by bond insurers. These securities
are almost exclusively investment grade and were generally
underwritten in accordance with our own investment standards
prior to the determination to purchase, without relying on the
bond insurer’s guarantee in making the investment decision.
These securities will continue to be monitored as part of our
on-going impairment analysis of our securities available for
sale, but are expected to perform, even if the rating agencies
reduce the credit rating of the bond insurers.
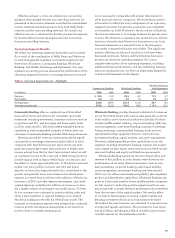
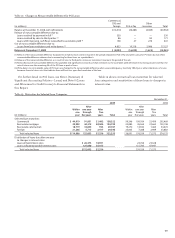
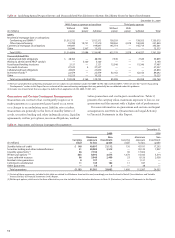
The weighted-average expected maturity of debt securities
available for sale was 5.6 years at December 31, 2009. Since
73% of this portfolio is MBS, the expected remaining maturity
may differ from contractual maturity because borrowers
generally have the right to prepay obligations before the
underlying mortgages mature. The estimated effect of a
200 basis point increase or decrease in interest rates on the
fair value and the expected remaining maturity of the MBS
available for sale are shown in Table 10.
See Note 5 (Securities Available for Sale) to Financial
Statements in this Report for securities available for sale by
security type.
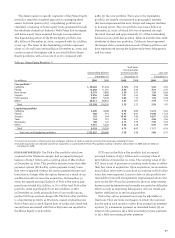
Balance Sheet Analysis
Table 10: Mortgage-Backed Securities
Net Expected
Fair unrealized remaining
(in billions) value gain (loss) maturity
At December 31, 2009 $122.4 2.5 4.0
At December 31, 2009,
assuming a 200 basis point:
Increase in interest rates 113.0 (6.9) 5.4
Decrease in interest rates 128.8 8.9 2.6