Wells Fargo 2009 Annual Report Download - page 139
Download and view the complete annual report
Please find page 139 of the 2009 Wells Fargo annual report below. You can navigate through the pages in the report by either clicking on the pages listed below, or by using the keyword search tool below to find specific information within the annual report.-
 1
1 -
2
-
3
-
4
-
5
-
6
-
7
-
8
-
9
-
10
-
11
-
12
-
13
-
14
-
15
-
16
-
17
-
18
-
19
-
20
-
21
-
22
-
23
-
24
-
25
-
26
-
27
-
28
-
29
-
30
-
31
-
32
-
33
-
34
-
35
-
36
-
37
-
38
-
39
-
40
-
41
-
42
-
43
-
44
-
45
-
46
-
47
-
48
-
49
-
50
-
51
-
52
-
53
-
54
-
55
-
56
-
57
-
58
-
59
-
60
-
61
-
62
-
63
-
64
-
65
-
66
-
67
-
68
-
69
-
70
-
71
-
72
-
73
-
74
-
75
-
76
-
77
-
78
-
79
-
80
-
81
-
82
-
83
-
84
-
85
-
86
-
87
-
88
-
89
-
90
-
91
-
92
-
93
-
94
-
95
-
96
-
97
-
98
-
99
-
100
-
101
-
102
-
103
-
104
-
105
-
106
-
107
-
108
-
109
-
110
-
111
-
112
-
113
-
114
-
115
-
116
-
117
-
118
-
119
-
120
-
121
-
122
-
123
-
124
-
125
-
126
-
127
-
128
-
 129
129 -
 130
130 -
 131
131 -
 132
132 -
 133
133 -
 134
134 -
 135
135 -
 136
136 -
 137
137 -
 138
138 -
 139
139 -
 140
140 -
 141
141 -
 142
142 -
 143
143 -
 144
144 -
 145
145 -
 146
146 -
 147
147 -
 148
148 -
 149
149 -
150
-
151
-
152
-
153
-
154
-
155
-
156
-
157
-
158
-
159
-
160
-
161
-
162
-
163
-
164
-
165
-
166
-
167
-
168
-
169
-
170
-
171
-
172
-
173
-
174
-
175
-
176
-
177
-
178
-
179
-
180
-
181
-
182
-
183
-
184
-
185
-
186
-
187
-
188
-
189
-
190
-
191
-
192
-
193
-
194
-
195
-
196
 |
 |

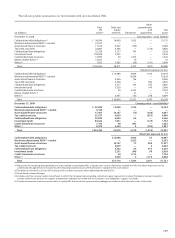
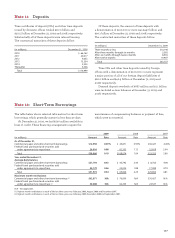
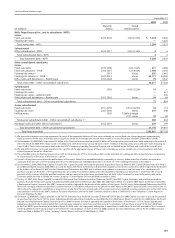
Note 12: Short-Term Borrowings
2009 2008 2007
(in millions) Amount Rate Amount Rate Amount Rate
As of December 31,
Commercial paper and other short-term borrowings $12,950 0.39% $ 45,871 0.93% $30,427 4.45%
Federal funds purchased and securities sold
under agreements to repurchase 26,016 0.08 62,203 1.12 22,828 2.94
Total $38,966 0.18 $108,074 1.04 $53,255 3.80
Year ended December 31,
Average daily balance
Commercial paper and other short-term borrowings $27,793 0.43 $ 43,792 2.43 $ 8,765 4.96
Federal funds purchased and securities sold
under agreements to repurchase 24,179 0.46 22,034 1.88 17,089 4.74
Total $51,972 0.44 $65,826 2.25 $25,854 4.81
Maximum month-end balance
Commercial paper and other short-term borrowings (1) $62,871 N/A $ 76,009 N/A $30,427 N/A
Federal funds purchased and securities sold
under agreements to repurchase (2) 30,608 N/A 62,203 N/A 23,527 N/A
N/A – Not applicable.
(1) Highest month-end balance in each of the last three years was February 2009, August 2008 and December 2007.
(2) Highest month-end balance in each of the last three years was February 2009, December 2008 and September 2007.
(in millions) December 31, 2009
Three months or less $10,146
After three months through six months 5,092
After six months through twelve months 8,592
After twelve months 19,907
Total $43,737
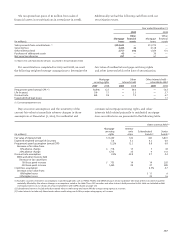
Time certificates of deposit (CDs) and other time deposits
issued by domestic offices totaled $117.0 billion and
$210.5 billion at December 31, 2009 and 2008, respectively.
Substantially all of these deposits were interest bearing.
The contractual maturities of these deposits follow.
Note 11: Deposits
Of these deposits, the amount of time deposits with
a denomination of $100,000 or more was $43.7 billion and
$90.1 billion at December 31, 2009 and 2008, respectively.
The contractual maturities of these deposits follow.
(in millions) December 31, 2009
2010 $ 66,162
2011 20,617
2012 9,635
2013 15,354
2014 2,225
Thereafter 3,006
Total $116,999
Time CDs and other time deposits issued by foreign
offices with a denomination of $100,000 or more represent
a major portion of all of our foreign deposit liabilities of
$60.0 billion and $40.9 billion at December 31, 2009 and
2008, respectively.
Demand deposit overdrafts of $667 million and $1.1 billion
were included as loan balances at December 31, 2009 and
2008, respectively.
The table below shows selected information for short-term
borrowings, which generally mature in less than 30 days.
At December 31, 2009, we had $500 million available in
lines of credit. These financing arrangements require the
maintenance of compensating balances or payment of fees,
which were not material.