Wells Fargo 2009 Annual Report Download - page 67
Download and view the complete annual report
Please find page 67 of the 2009 Wells Fargo annual report below. You can navigate through the pages in the report by either clicking on the pages listed below, or by using the keyword search tool below to find specific information within the annual report.-
 1
1 -
2
-
3
-
4
-
5
-
6
-
7
-
8
-
9
-
10
-
11
-
12
-
13
-
14
-
15
-
16
-
17
-
18
-
19
-
20
-
21
-
22
-
23
-
24
-
25
-
26
-
27
-
28
-
29
-
30
-
31
-
32
-
33
-
34
-
35
-
36
-
37
-
38
-
39
-
40
-
41
-
42
-
43
-
44
-
45
-
46
-
47
-
48
-
49
-
50
-
51
-
52
-
53
-
54
-
55
-
56
-
 57
57 -
 58
58 -
 59
59 -
 60
60 -
 61
61 -
 62
62 -
 63
63 -
 64
64 -
 65
65 -
 66
66 -
 67
67 -
 68
68 -
 69
69 -
 70
70 -
 71
71 -
 72
72 -
 73
73 -
 74
74 -
 75
75 -
 76
76 -
 77
77 -
78
-
79
-
80
-
81
-
82
-
83
-
84
-
85
-
86
-
87
-
88
-
89
-
90
-
91
-
92
-
93
-
94
-
95
-
96
-
97
-
98
-
99
-
100
-
101
-
102
-
103
-
104
-
105
-
106
-
107
-
108
-
109
-
110
-
111
-
112
-
113
-
114
-
115
-
116
-
117
-
118
-
119
-
120
-
121
-
122
-
123
-
124
-
125
-
126
-
127
-
128
-
129
-
130
-
131
-
132
-
133
-
134
-
135
-
136
-
137
-
138
-
139
-
140
-
141
-
142
-
143
-
144
-
145
-
146
-
147
-
148
-
149
-
150
-
151
-
152
-
153
-
154
-
155
-
156
-
157
-
158
-
159
-
160
-
161
-
162
-
163
-
164
-
165
-
166
-
167
-
168
-
169
-
170
-
171
-
172
-
173
-
174
-
175
-
176
-
177
-
178
-
179
-
180
-
181
-
182
-
183
-
184
-
185
-
186
-
187
-
188
-
189
-
190
-
191
-
192
-
193
-
194
-
195
-
196
 |
 |

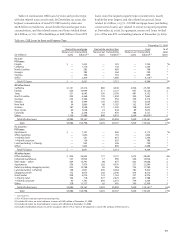
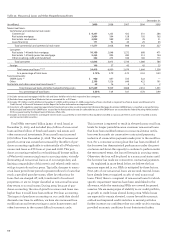
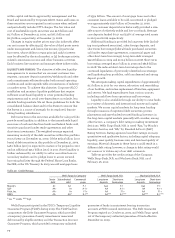
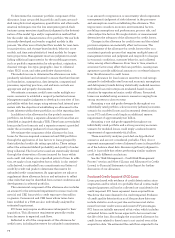
Table 29: Allocation of the Allowance for Credit Losses (ACL)
December 31,
2009 2008 2007 2006 2005
Loans Loans Loans Loans Loans
as % as % as % as % as %
of total of total of total of total of total
(in millions) ACL loans ACL loans ACL loans ACL loans ACL loans
Commercial and commercial real estate:
Commercial $ 4,175 20% $ 4,129 23% $1,137 24% $1,051 22% $ 926 20%
Real estate mortgage 2,577 13 1,011 12 288 9 225 9 253 9
Real estate construction 1,063 4 1,023 4 156 5 109 5 115 4
Lease financing 181 2 135 2 51 2 40 2 51 2
Total commercial and commercial real estate 7,996 39 6,298 41 1,632 40 1,425 38 1,345 35
Consumer:
Real estate 1-4 family first mortgage 6,407 29 4,938 28 415 19 186 17 229 25
Real estate 1-4 family junior lien mortgage 5,311 13 4,496 13 1,329 20 168 21 118 19
Credit card 2,745 3 2,463 3 834 5 606 5 508 4
Other revolving credit and installment 2,266 12 3,251 11 1,164 14 1,434 17 1,060 15
Total consumer 16,729 57 15,148 55 3,742 58 2,394 60 1,915 63
Foreign 306 4 265 4 144 2 145 2 149 2
Total allocated 25,031 100%21,711 100%5,518 100%3,964 100%3,409 100%
Unallocated component of allowance —— — — 648
Total $25,031 $21,711 $5,518 $3,964 $4,057
In 2008, the provision of $16.0 billion included a credit
reserve build of $8.1 billion in excess of net charge-offs, which
included $3.9 billion to conform loss emergence coverage
periods to the most conservative of each company within
FFIEC guidelines. The remainder of the reserve build was
attributable to higher projected loss rates across the majority
of the consumer credit businesses, and some credit deteriora-
tion and growth in the wholesale portfolios.
In 2007, the provision of $4.9 billion included a credit
reserve build of $1.4 billion in excess of net charge-offs, which
was our estimate of the increase in incurred losses in our loan
portfolio at year-end 2007, primarily related to the Home
Equity portfolio.
Table 29 presents the allocation of the allowance for
credit losses by type of loans. The $3.3 billion increase in the
allowance for credit losses from year-end 2008 to year-end
2009 largely reflects continued stress in both the commercial
and residential real estate sectors, and includes reserve builds
reflecting the significant increase in modified residential real
estate loans that result in TDRs. In determining the appropriate
allowance attributable to our residential real estate portfolios,
the loss rates used in our analysis include the impacts of our
established loan modification programs. When modifications
occur or are probable to occur, our allowance reflects the
impact of these modifications, taking into consideration the
associated credit cost, including re-defaults of modified loans
and projected loss severity. The loss content associated with
existing and probable loan modifications has been considered
in our allowance reserving methodology.
Changes in the allowance reflect changes in statistically
derived loss estimates, historical loss experience, current
trends in borrower risk and/or general economic activity
on portfolio performance, and management’s estimate for
imprecision and uncertainty. Effective December 31, 2006,
the entire allowance was assigned to individual portfolio
types to better reflect our view of risk in these portfolios.
The allowance for credit losses includes a combination
of baseline loss estimates and a range of imprecision or
uncertainty specific to each portfolio segment previously
categorized as unallocated in prior years.
We believe the allowance for credit losses of $25.0 billion
was adequate to cover credit losses inherent in the loan portfolio,
including unfunded credit commitments, at December 31, 2009.
The allowance for credit losses is subject to change and
considers existing factors at the time, including economic
or market conditions and ongoing internal and external
examination processes. Due to the sensitivity of the allowance
for credit losses to changes in the economic environment,
it is possible that unanticipated economic deterioration
would create incremental credit losses not anticipated as
of the balance sheet date. Our process for determining the
adequacy of the allowance for credit losses is discussed in the
“Critical Accounting Policies – Allowance for Credit Losses”
section and Note 6 (Loans and Allowance for Credit Losses)
to Financial Statements in this Report.
RESERVE FOR MORTGAGE LOAN REPURCHASE LOSSES We sell
mortgage loans to various parties, including government-
sponsored entities (GSEs), under contractual provisions that
include various representations and warranties which typically
cover ownership of the loan, compliance with loan criteria set
forth in the applicable agreement, validity of the lien securing
the loan, absence of delinquent taxes or liens against the
property securing the loan, and similar matters. We may be
required to repurchase the mortgage loans with identified
defects, indemnify the investor or insurer, or reimburse the
investor for credit loss incurred on the loan (collectively
“repurchase”) in the event of a material breach of such con-
tractual representations or warranties. On occasion, we may
negotiate global settlements in order to resolve a pipeline of