Wells Fargo 2009 Annual Report Download - page 79
Download and view the complete annual report
Please find page 79 of the 2009 Wells Fargo annual report below. You can navigate through the pages in the report by either clicking on the pages listed below, or by using the keyword search tool below to find specific information within the annual report.-
 1
1 -
2
-
3
-
4
-
5
-
6
-
7
-
8
-
9
-
10
-
11
-
12
-
13
-
14
-
15
-
16
-
17
-
18
-
19
-
20
-
21
-
22
-
23
-
24
-
25
-
26
-
27
-
28
-
29
-
30
-
31
-
32
-
33
-
34
-
35
-
36
-
37
-
38
-
39
-
40
-
41
-
42
-
43
-
44
-
45
-
46
-
47
-
48
-
49
-
50
-
51
-
52
-
53
-
54
-
55
-
56
-
57
-
58
-
59
-
60
-
61
-
62
-
63
-
64
-
65
-
66
-
67
-
68
-
 69
69 -
 70
70 -
 71
71 -
 72
72 -
 73
73 -
 74
74 -
 75
75 -
 76
76 -
 77
77 -
 78
78 -
 79
79 -
 80
80 -
 81
81 -
 82
82 -
 83
83 -
 84
84 -
 85
85 -
 86
86 -
 87
87 -
 88
88 -
 89
89 -
90
-
91
-
92
-
93
-
94
-
95
-
96
-
97
-
98
-
99
-
100
-
101
-
102
-
103
-
104
-
105
-
106
-
107
-
108
-
109
-
110
-
111
-
112
-
113
-
114
-
115
-
116
-
117
-
118
-
119
-
120
-
121
-
122
-
123
-
124
-
125
-
126
-
127
-
128
-
129
-
130
-
131
-
132
-
133
-
134
-
135
-
136
-
137
-
138
-
139
-
140
-
141
-
142
-
143
-
144
-
145
-
146
-
147
-
148
-
149
-
150
-
151
-
152
-
153
-
154
-
155
-
156
-
157
-
158
-
159
-
160
-
161
-
162
-
163
-
164
-
165
-
166
-
167
-
168
-
169
-
170
-
171
-
172
-
173
-
174
-
175
-
176
-
177
-
178
-
179
-
180
-
181
-
182
-
183
-
184
-
185
-
186
-
187
-
188
-
189
-
190
-
191
-
192
-
193
-
194
-
195
-
196
 |
 |
When an active market for a financial instrument does not
exist, the use of management estimates that incorporate
current market participant expectations of future cash flows,
adjusted for an appropriate risk premium, is acceptable.
In connection with the first quarter 2009 adoption of the
new fair value measurement guidance included in FASB ASC
820, Fair Value Measurements and Disclosures, we developed
policies and procedures to determine when markets for our
financial assets and liabilities are inactive if the level and vol-
ume of activity has declined significantly relative to normal
conditions. If markets are determined to be inactive, it may be
appropriate to adjust price quotes received. The methodology
we use to adjust the quotes generally involves weighting the
price quotes and results of internal pricing techniques, such
as the net present value of future expected cash flows (with
observable inputs, where available) discounted at a rate of
return market participants require to arrive at the fair value.
The more active and orderly markets for particular security
classes are determined to be, the more weighting we assign to
price quotes. The less active and orderly markets are deter-
mined to be, the less weighting we assign to price quotes.
We may use independent pricing services and brokers to
obtain fair values based on quoted prices. We determine the
most appropriate and relevant pricing service for each security
class and generally obtain one quoted price for each security.
For certain securities, we may use internal traders to obtain
quoted prices. Quoted prices are subject to our internal price
verification procedures. We validate prices received using a
variety of methods, including, but not limited to, comparison
to pricing services, corroboration of pricing by reference to
other independent market data such as secondary broker
quotes and relevant benchmark indices, and review of pricing
by Company personnel familiar with market liquidity and
other market-related conditions. We believe the determina-
tion of fair value for our securities is consistent with the
accounting guidance on fair value measurements.
Significant judgment may be required to determine
whether certain assets measured at fair value are included in
Level 2 or Level 3. When making this judgment, we consider
all available information, including observable market data,
indications of market liquidity and orderliness, and our
understanding of the valuation techniques and significant
inputs used. For securities in inactive markets, we use a pre-
determined percentage to evaluate the impact of fair value
adjustments derived from weighting both external and inter-
nal indications of value to determine if the instrument is
classified as Level 2 or Level 3. Otherwise, the classification
of Level 2 or Level 3 is based upon the specific facts and
circumstances of each instrument or instrument category
and judgments are made regarding the significance of the
Level 3 inputs to the instruments’ fair value measurement in
its entirety. If Level 3 inputs are considered significant, the
instrument is classified as Level 3.
Our financial assets valued using Level 3 measurements
consisted of certain asset-backed securities, including those
collateralized by auto leases or loans and cash reserves, pri-
vate collateralized mortgage obligations (CMOs), collateral-
ized debt obligations (CDOs), collateralized loan obligations
(CLOs), auction-rate securities, certain derivative contracts
such as credit default swaps related to CMO, CDO and CLO
exposures and certain MHFS and MSRs.
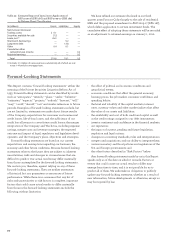
Approximately 22% of total assets ($277.4 billion) at
December 31, 2009, and 19% of total assets ($247.5 billion) at
December 31, 2008, consisted of financial instruments recorded
at fair value on a recurring basis. The fair value of assets
measured using significant Level 3 inputs (before derivative
netting adjustments) represented approximately 19% of these
financial instruments (4% of total assets) at December 31, 2009,
and approximately 22% (4% of total assets) at December 31, 2008.
The fair value of the remaining assets was measured using
valuation methodologies involving market-based or market-
derived information, collectively Level 1 and 2 measurements.
Approximately 2% of total liabilities ($22.8 billion) at
December 31, 2009, and 2% ($18.8 billion) at December 31,
2008, consisted of financial instruments recorded at fair value
on a recurring basis. The fair value of liabilities measured
using Level 3 inputs (before derivative netting adjustments)
was $7.9 billion and $9.3 billion at December 31, 2009 and
2008, respectively.
See Note 16 (Fair Values of Assets and Liabilities) to
Financial Statements in this Report for a complete discussion
on our use of fair valuation of financial instruments, our
related measurement techniques and its impact to our
financial statements.
Pension Accounting
We account for our defined benefit pension plans using an
actuarial model. The funded status of our pension and postre-
tirement benefit plans is recognized in our balance sheet.
In 2008, we began measuring our plan assets and benefit
obligations using a year-end measurement date.
On April 28, 2009, the Board approved amendments to freeze
the benefits earned under the Wells Fargo qualified and sup-
plemental Cash Balance Plans and the Wachovia Corporation
Pension Plan, and to merge the Pension Plan into the qualified
Cash Balance Plan. These actions became effective on July 1, 2009.
We use four key variables to calculate our annual pension
cost: size and characteristics of the employee population,
actuarial assumptions, expected long-term rate of return on
plan assets, and discount rate. We describe below the effect
of each of these variables on our pension expense.
SIZE AND CHARACTERISTICS OF THE EMPLOYEE POPULATION
Pension expense is directly related to the number of employees
covered by the plans, and other factors including salary, age
and years of employment. As of July 1, 2009, pension expense
will no longer be dependent on salaries earned and service
cost will no longer be recognized for the plans that were
frozen in 2009. In 2009, pension expense for the qualified and
unqualified Cash Balance plans was about $317 million, which
includes one-time curtailment gains of $59 million resulting
from the freezing of these plans. In 2010, pension expense
for these plans is estimated to be a credit of approximately
$44 million; the decrease in pension expense in 2010 is
primarily due to no longer incurring service cost.