Wells Fargo 2009 Annual Report Download - page 120
Download and view the complete annual report
Please find page 120 of the 2009 Wells Fargo annual report below. You can navigate through the pages in the report by either clicking on the pages listed below, or by using the keyword search tool below to find specific information within the annual report.-
 1
1 -
2
-
3
-
4
-
5
-
6
-
7
-
8
-
9
-
10
-
11
-
12
-
13
-
14
-
15
-
16
-
17
-
18
-
19
-
20
-
21
-
22
-
23
-
24
-
25
-
26
-
27
-
28
-
29
-
30
-
31
-
32
-
33
-
34
-
35
-
36
-
37
-
38
-
39
-
40
-
41
-
42
-
43
-
44
-
45
-
46
-
47
-
48
-
49
-
50
-
51
-
52
-
53
-
54
-
55
-
56
-
57
-
58
-
59
-
60
-
61
-
62
-
63
-
64
-
65
-
66
-
67
-
68
-
69
-
70
-
71
-
72
-
73
-
74
-
75
-
76
-
77
-
78
-
79
-
80
-
81
-
82
-
83
-
84
-
85
-
86
-
87
-
88
-
89
-
90
-
91
-
92
-
93
-
94
-
95
-
96
-
97
-
98
-
99
-
100
-
101
-
102
-
103
-
104
-
105
-
106
-
107
-
108
-
109
-
 110
110 -
 111
111 -
 112
112 -
 113
113 -
 114
114 -
 115
115 -
 116
116 -
 117
117 -
 118
118 -
 119
119 -
 120
120 -
 121
121 -
 122
122 -
 123
123 -
 124
124 -
 125
125 -
 126
126 -
 127
127 -
 128
128 -
 129
129 -
 130
130 -
131
-
132
-
133
-
134
-
135
-
136
-
137
-
138
-
139
-
140
-
141
-
142
-
143
-
144
-
145
-
146
-
147
-
148
-
149
-
150
-
151
-
152
-
153
-
154
-
155
-
156
-
157
-
158
-
159
-
160
-
161
-
162
-
163
-
164
-
165
-
166
-
167
-
168
-
169
-
170
-
171
-
172
-
173
-
174
-
175
-
176
-
177
-
178
-
179
-
180
-
181
-
182
-
183
-
184
-
185
-
186
-
187
-
188
-
189
-
190
-
191
-
192
-
193
-
194
-
195
-
196
 |
 |

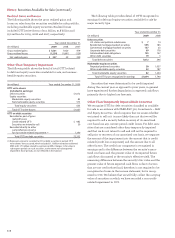
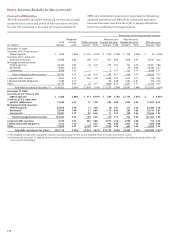
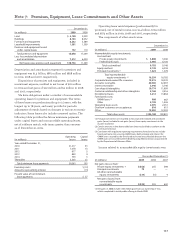
Contractual Maturities
The following table shows the remaining contractual principal
maturities and contractual yields of debt securities available
for sale. The remaining contractual principal maturities for
MBS were determined assuming no prepayments. Remaining
expected maturities will differ from contractual maturities
because borrowers may have the right to prepay obligations
before the underlying mortgages mature.
Note 5: Securities Available for Sale (continued)
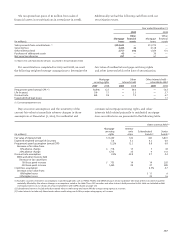
Remaining contractual principal maturity
Weighted- After one year After five years
Total average Within one year through five years through ten years After ten years
(in millions) amount yield Amount Yield Amount Yield Amount Yield Amount Yield
December 31, 2008
Securities of U.S. Treasury and
federal agencies $ 3,249 1.63% $ 1,720 0.02% $ 1,120 3.36% $ 395 3.54% $ 14 5.05%
Securities of U.S. states and
political subdivisions 12,658 6.80 189 5.77 672 6.84 1,040 6.74 10,757 6.82
Mortgage-backed securities:
Federal agencies 66,434 5.87 42 4.24 129 5.03 322 5.73 65,941 5.88
Residential 24,830 5.57 — — — — 47 4.95 24,783 5.57
Commercial 8,478 5.32 — — 5 1.57 135 6.13 8,338 5.31
Total mortgage-backed securities 99,742 5.75 42 4.24 134 4.91 504 5.76 99,062 5.75
Corporate debt securities 6,924 5.15 492 5.00 3,683 4.31 2,231 6.71 518 4.49
Collateralized debt obligations 2,085 4.17 — — 90 5.68 1,081 4.81 914 3.26
Other 20,775 4.76 53 4.71 7,880 6.75 1,691 3.71 11,151 3.52
Total debt securities at fair value (1)(2) $ 145,433 5.56% $ 2,496 1.61% $ 13,579 5.79% $ 6,942 5.44% $ 122,416 5.62%
December 31, 2009
Securities of U.S. Treasury and
federal agencies $ 2,280 2.80% $ 413 0.79% $ 669 2.14% $1,192 3.87% $ 6 4.03%
Securities of U.S. states and
political subdivisions 13,530 6.75 77 7.48 703 6.88 1,055 6.56 11,695 6.76
Mortgage-backed securities:
Federal agencies 82,818 5.50 12 4.68 50 5.91 271 5.56 82,485 5.50
Residential 28,590 5.40 51 4.80 115 0.45 283 5.69 28,141 5.41
Commercial 10,961 5.29 85 0.68 71 5.55 169 5.66 10,636 5.32
Total mortgage-backed securities 122,369 5.46 148 2.44 236 3.14 723 5.63 121,262 5.46
Corporate debt securities 9,335 5.53 684 4.00 3,937 5.68 3,959 5.68 755 5.32
Collateralized debt obligations 3,725 1.70 2 5.53 492 4.48 1,837 1.56 1,394 0.90
Other 15,879 4.22 2,128 5.62 7,762 5.96 697 2.46 5,292 1.33
Total debt securities at fair value (1) $167,118 5.33% $3,452 4.63% $13,799 5.64% $9,463 4.51% $140,404 5.37%
(1) The weighted-average yield is computed using the contractual coupon of each security weighted based on the fair value of each security.
(2) Information for December 31, 2008, has been revised to conform the determination of remaining contractual principal maturities and weighted-average yields to the
current period methodology.