Wells Fargo 2009 Annual Report Download - page 58
Download and view the complete annual report
Please find page 58 of the 2009 Wells Fargo annual report below. You can navigate through the pages in the report by either clicking on the pages listed below, or by using the keyword search tool below to find specific information within the annual report.-
 1
1 -
2
-
3
-
4
-
5
-
6
-
7
-
8
-
9
-
10
-
11
-
12
-
13
-
14
-
15
-
16
-
17
-
18
-
19
-
20
-
21
-
22
-
23
-
24
-
25
-
26
-
27
-
28
-
29
-
30
-
31
-
32
-
33
-
34
-
35
-
36
-
37
-
38
-
39
-
40
-
41
-
42
-
43
-
44
-
45
-
46
-
47
-
 48
48 -
 49
49 -
 50
50 -
 51
51 -
 52
52 -
 53
53 -
 54
54 -
 55
55 -
 56
56 -
 57
57 -
 58
58 -
 59
59 -
 60
60 -
 61
61 -
 62
62 -
 63
63 -
 64
64 -
 65
65 -
 66
66 -
 67
67 -
 68
68 -
69
-
70
-
71
-
72
-
73
-
74
-
75
-
76
-
77
-
78
-
79
-
80
-
81
-
82
-
83
-
84
-
85
-
86
-
87
-
88
-
89
-
90
-
91
-
92
-
93
-
94
-
95
-
96
-
97
-
98
-
99
-
100
-
101
-
102
-
103
-
104
-
105
-
106
-
107
-
108
-
109
-
110
-
111
-
112
-
113
-
114
-
115
-
116
-
117
-
118
-
119
-
120
-
121
-
122
-
123
-
124
-
125
-
126
-
127
-
128
-
129
-
130
-
131
-
132
-
133
-
134
-
135
-
136
-
137
-
138
-
139
-
140
-
141
-
142
-
143
-
144
-
145
-
146
-
147
-
148
-
149
-
150
-
151
-
152
-
153
-
154
-
155
-
156
-
157
-
158
-
159
-
160
-
161
-
162
-
163
-
164
-
165
-
166
-
167
-
168
-
169
-
170
-
171
-
172
-
173
-
174
-
175
-
176
-
177
-
178
-
179
-
180
-
181
-
182
-
183
-
184
-
185
-
186
-
187
-
188
-
189
-
190
-
191
-
192
-
193
-
194
-
195
-
196
 |
 |

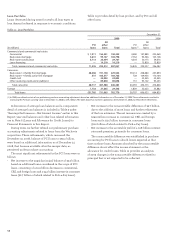
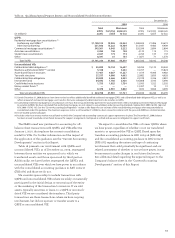
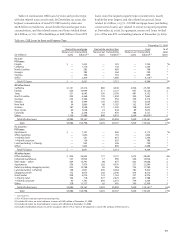
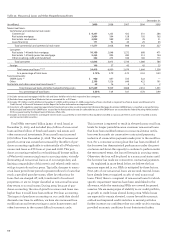
COMMERCIAL LOANS AND LEASE FINANCING For purposes of
portfolio risk management, we aggregate commercial loans
and lease financing according to market segmentation and
standard industry codes. Table 21 summarizes commercial
loans and lease financing by industry with the related
nonaccrual totals. This portfolio has experienced less credit
deterioration than our CRE portfolio as evidenced by its
lower nonaccrual rate of 2.6% compared with 5.2% for the CRE
portfolios. We believe this portfolio is well underwritten and
is diverse in its risk with relatively even concentrations across
several industries.
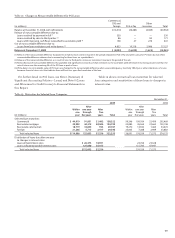
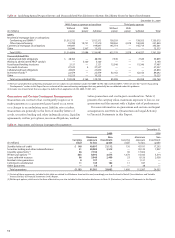
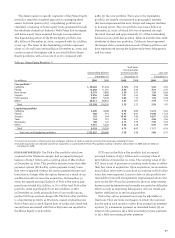
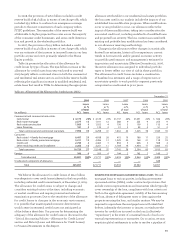
REAL ESTATE - FAMILY FIRST MORTGAGE LOANS As part of the
Wachovia acquisition, we acquired residential first and home
equity loans that are very similar to the Wells Fargo core
originated portfolio. We also acquired the Pick-a-Pay portfolio,
which is composed primarily of option payment adjustable-rate
mortgage and fixed-rate mortgage products. Under purchase
accounting for the Wachovia acquisition, we made purchase
accounting adjustments to the Pick-a-Pay loans considered
to be impaired under accounting guidance for PCI loans.
See the “Risk Management – Pick-a-Pay Portfolio” section
in this Report for additional detail.
Table 22: Real Estate 1-4 Family Mortgage Loans by State
December 31, 2009
Real estate Real estate Total real
1-4 family 1-4 family estate 1-4 % of
first junior lien family total
(in millions) mortgage mortgage mortgage loans
PCI loans:
California $ 25,265 82 25,347 3%
Florida 4,288 67 4,355 1
New Jersey 1,196 34 1,230 *
Other (1) 7,637 148 7,785 1
Total PCI loans $ 38,386 331 38,717 5%
All other loans:
California $ 52,229 29,731 81,960 11%
Florida 19,284 9,210 28,494 4
New Jersey 9,230 6,801 16,031 2
Virginia 5,915 4,995 10,910 1
New York 6,769 4,071 10,840 1
Pennsylvania 6,396 4,343 10,739 1
North Carolina 6,464 4,043 10,507 1
Georgia 5,003 3,816 8,819 1
Texas 6,900 1,769 8,669 1
Other (2) 72,960 34,598 107,558 14
Total all
other loans $191,150 103,377 294,527 37%
Total $229,536 103,708 333,244 42%
* Less than 1%.
(1) Consists of 47 states; no state had loans in excess of $975 million.
(2) Consists of 41 states; no state had loans in excess of $7.8 billion.
Includes $15.2 billion in GNMA pool buyouts.
Table 21: Commercial Loans and Lease Financing by Industry
December 31, 2009
% of
Nonaccrual Outstanding total
(in millions) loans balance(1) loans
PCI loans:
Real estate investment trust $ — 351 *%
Media — 314 *
Investors — 140 *
Residential construction — 122 *
Insurance — 118 *
Leisure — 110 *
Other — 756(2) *
Total PCI loans $ — 1,911 *%
All other loans:
Financial institutions $ 496 11,111 1%
Oil and gas 202 8,464 1
Healthcare 88 8,397 1
Cyclical retailers 77 8,316 1
Industrial equipment 71 8,188 1
Food and beverage 119 7,524 1
Real estate – other 99 6,722 1
Business services 167 6,570 1
Transportation 31 6,469 1
Public administration 17 5,785 1
Technology 15 5,752 1
Utilities 72 5,489 1
Other 3,114 81,864(3) 10
Total all other loans $4,568 170,651 22%
Total $4,568 172,562 22%
* Less than 1%.
(1) For PCI loans amounts represent carrying value.
(2) No other single category had loans in excess of $87 million.
(3) No other single category had loans in excess of $5.3 billion. The next largest
categories included investors, hotel/restaurant, media, securities firms,
non-residential construction, leisure, trucking, dairy, gaming and contractors.
The concentrations of real estate 1-4 family mortgage
loans by state are presented in Table 22. Our real estate 1-4
family mortgage loans to borrowers in the state of California
represented approximately 14% of total loans at both
December 31, 2009 and 2008, mostly within the larger
metropolitan areas, with no single area consisting of more
than 3% of total loans. Of this amount, 3% of total loans were
PCI loans from Wachovia. Changes in real estate values and
underlying economic or market conditions for these areas are
monitored continuously within the credit risk management
process. Beginning in 2007, the residential real estate markets
began to experience significant declines in property values
and several markets in California, specifically in Southern
California and the Central Valley, experienced declines that
turned out to be more significant than the national decline.
Some of our real estate 1-4 family mortgage loans, including
first mortgage and home equity products, include an interest-
only feature as part of the loan terms. At December 31, 2009,
these loans were approximately 15% of total loans, compared
with 11% at the end of 2008. Most of these loans are considered
to be prime or near prime. We have manageable adjustable-
rate mortgage (ARM) reset risk across our Wells Fargo
originated and owned mortgage loan portfolios.