Wells Fargo 2009 Annual Report Download - page 63
Download and view the complete annual report
Please find page 63 of the 2009 Wells Fargo annual report below. You can navigate through the pages in the report by either clicking on the pages listed below, or by using the keyword search tool below to find specific information within the annual report.-
 1
1 -
2
-
3
-
4
-
5
-
6
-
7
-
8
-
9
-
10
-
11
-
12
-
13
-
14
-
15
-
16
-
17
-
18
-
19
-
20
-
21
-
22
-
23
-
24
-
25
-
26
-
27
-
28
-
29
-
30
-
31
-
32
-
33
-
34
-
35
-
36
-
37
-
38
-
39
-
40
-
41
-
42
-
43
-
44
-
45
-
46
-
47
-
48
-
49
-
50
-
51
-
52
-
 53
53 -
 54
54 -
 55
55 -
 56
56 -
 57
57 -
 58
58 -
 59
59 -
 60
60 -
 61
61 -
 62
62 -
 63
63 -
 64
64 -
 65
65 -
 66
66 -
 67
67 -
 68
68 -
 69
69 -
 70
70 -
 71
71 -
 72
72 -
 73
73 -
74
-
75
-
76
-
77
-
78
-
79
-
80
-
81
-
82
-
83
-
84
-
85
-
86
-
87
-
88
-
89
-
90
-
91
-
92
-
93
-
94
-
95
-
96
-
97
-
98
-
99
-
100
-
101
-
102
-
103
-
104
-
105
-
106
-
107
-
108
-
109
-
110
-
111
-
112
-
113
-
114
-
115
-
116
-
117
-
118
-
119
-
120
-
121
-
122
-
123
-
124
-
125
-
126
-
127
-
128
-
129
-
130
-
131
-
132
-
133
-
134
-
135
-
136
-
137
-
138
-
139
-
140
-
141
-
142
-
143
-
144
-
145
-
146
-
147
-
148
-
149
-
150
-
151
-
152
-
153
-
154
-
155
-
156
-
157
-
158
-
159
-
160
-
161
-
162
-
163
-
164
-
165
-
166
-
167
-
168
-
169
-
170
-
171
-
172
-
173
-
174
-
175
-
176
-
177
-
178
-
179
-
180
-
181
-
182
-
183
-
184
-
185
-
186
-
187
-
188
-
189
-
190
-
191
-
192
-
193
-
194
-
195
-
196
 |
 |

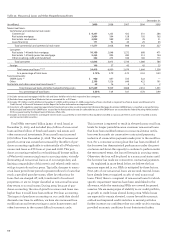
Commercial and CRE nonaccrual loans amounted to
$11.6 billion at December 31, 2009, compared with $2.9 billion
at December 31, 2008. Of the $11.6 billion total commercial
and CRE nonaccrual loans at December 31, 2009:
• $7.4 billion have had $1.0 billion of loan impairments
recorded for expected life-of-loan losses in accordance
with impairment accounting standards;
• the remaining $4.2 billion have reserves as part of the
allowance for loan losses;
• $10.7 billion (93%) are secured, of which $7.0 billion (61%)
are secured by real estate, and the remainder secured by
other assets such as receivables, inventory and equipment;
• over one-third of these nonaccrual loans are paying
interest that is being applied to principal; and
• 31% have been written down by approximately 52%.
Consumer nonaccrual loans (including nonaccrual
troubled debt restructurings (TDRs)) amounted to
$12.7 billion at December 31, 2009, compared with $3.8 billion
at December 31, 2008. The $8.9 billion increase in nonaccrual
consumer loans from December 31, 2008, represented an
increase of $7.5 billion in 1-4 family first mortgage loans
and an increase of $1.4 billion in 1-4 family junior liens. In
addition, there were accruing consumer TDRs of $6.2 billion
at December 31, 2009. Of the $18.9 billion of consumer
nonaccrual loans and accruing TDRs:
• $6.1 billion have had charge-offs totaling $2.6 billion;
consumer loans secured by real estate are charged-off
to the appraised value, less cost to sell, of the underlying
collateral when these loans reach 180 days delinquent;
• $8.3 billion have $1.8 billion in life-of-loan TDR loss
impairment reserves in addition to any charge-offs; and
• the remaining $10.6 billion have reserves as part of the
allowance for loan losses.
Of the $12.7 billion of consumer nonaccrual loans:
• $12.6 billion (99%) are secured, substantially all by
real estate; and
• 21% have a combined LTV ratio of 80% or below.
NPAs at December 31, 2009, included $960 million of loans
that are FHA insured or VA guaranteed, which have little to no
loss content, and $2.2 billion of foreclosed assets, which have
been written down to the value of the underlying collateral.
Foreclosed assets included $852 million that resulted from
PCI loans.
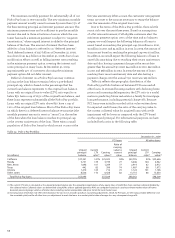
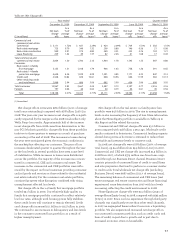
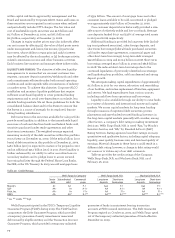
Table 26 summarizes NPAs for each of the four quarters
of 2009. It shows a trend of declining increase in NPAs after
the first quarter of 2009.
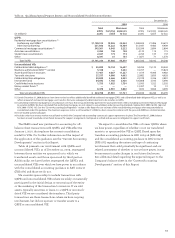
Table 26: Nonaccrual Loans and Other Nonperforming Assets During 2009
December 31, 2009 September 30, 2009 June 30, 2009 March 31, 2009
As a As a As a As a
% of % of % of % of
total total total total
($ in millions) Balances loans Balances loans Balances loans Balances loans
Commercial and commercial real estate:
Commercial $ 4,397 2.78% $ 4,540 2.68% $ 2,910 1.60% $ 1,696 0.88%
Real estate mortgage 3,984 3.80 2,856 2.76 2,343 2.26 1,324 1.26
Real estate construction 3,025 10.18 2,711 8.55 2,210 6.65 1,371 4.04
Lease financing 171 1.20 157 1.11 130 0.89 114 0.77
Total commercial and commercial real estate 11,577 3.77 10,264 3.22 7,593 2.28 4,505 1.30
Consumer:
Real estate 1-4 family first mortgage 10,100 4.40 8,132 3.50 6,000 2.53 4,218 1.74
Real estate 1-4 family junior lien mortgage 2,263 2.18 1,985 1.90 1,652 1.54 1,418 1.29
Other revolving credit and installment 332 0.37 344 0.38 327 0.36 300 0.33
Total consumer 12,695 2.84 10,461 2.32 7,979 1.74 5,936 1.27
Foreign 146 0.50 144 0.48 226 0.75 75 0.24
Total nonaccrual loans 24,418 3.12 20,869 2.61 15,798 1.92 10,516 1.25
Foreclosed assets:
GNMA loans 960 840 932 768
All other 2,199 1,687 1,592 1,294
Total foreclosed assets 3,159 2,527 2,524 2,062
Real estate and other nonaccrual investments 62 55 20 34
Total nonaccrual loans and other
nonperforming assets $27,639 3.53% $23,451 2.93% $18,342 2.23% $12,612 1.50%
Change from prior quarter $ 4,188 5,109 5,730 3,603