Wells Fargo 2009 Annual Report Download - page 46
Download and view the complete annual report
Please find page 46 of the 2009 Wells Fargo annual report below. You can navigate through the pages in the report by either clicking on the pages listed below, or by using the keyword search tool below to find specific information within the annual report.-
 1
1 -
2
-
3
-
4
-
5
-
6
-
7
-
8
-
9
-
10
-
11
-
12
-
13
-
14
-
15
-
16
-
17
-
18
-
19
-
20
-
21
-
22
-
23
-
24
-
25
-
26
-
27
-
28
-
29
-
30
-
31
-
32
-
33
-
34
-
35
-
 36
36 -
 37
37 -
 38
38 -
 39
39 -
 40
40 -
 41
41 -
 42
42 -
 43
43 -
 44
44 -
 45
45 -
 46
46 -
 47
47 -
 48
48 -
 49
49 -
 50
50 -
 51
51 -
 52
52 -
 53
53 -
 54
54 -
 55
55 -
 56
56 -
57
-
58
-
59
-
60
-
61
-
62
-
63
-
64
-
65
-
66
-
67
-
68
-
69
-
70
-
71
-
72
-
73
-
74
-
75
-
76
-
77
-
78
-
79
-
80
-
81
-
82
-
83
-
84
-
85
-
86
-
87
-
88
-
89
-
90
-
91
-
92
-
93
-
94
-
95
-
96
-
97
-
98
-
99
-
100
-
101
-
102
-
103
-
104
-
105
-
106
-
107
-
108
-
109
-
110
-
111
-
112
-
113
-
114
-
115
-
116
-
117
-
118
-
119
-
120
-
121
-
122
-
123
-
124
-
125
-
126
-
127
-
128
-
129
-
130
-
131
-
132
-
133
-
134
-
135
-
136
-
137
-
138
-
139
-
140
-
141
-
142
-
143
-
144
-
145
-
146
-
147
-
148
-
149
-
150
-
151
-
152
-
153
-
154
-
155
-
156
-
157
-
158
-
159
-
160
-
161
-
162
-
163
-
164
-
165
-
166
-
167
-
168
-
169
-
170
-
171
-
172
-
173
-
174
-
175
-
176
-
177
-
178
-
179
-
180
-
181
-
182
-
183
-
184
-
185
-
186
-
187
-
188
-
189
-
190
-
191
-
192
-
193
-
194
-
195
-
196
 |
 |

increased delinquencies and heightened investor repurchase
demands on prior years loan sales within the current
environment. To the extent that economic conditions and the
housing market do not recover or future investor repurchase
demand and appeals success rates differ from past experience,
we could continue to have increased demands and increased
loss severity on repurchases, causing future additions to the
repurchase reserve. For additional information about mort-
gage loan repurchases, see the “Risk Management – Credit
Risk Management Process – Reserve for Mortgage Loan
Repurchase Losses” section in this Report. Net write-downs
for mortgage loans while they were in the warehouse/pipeline
totaled $164 million during 2009 and $584 million during
2008, due to the deterioration in the overall credit market
and related secondary market liquidity challenges. Similar
losses on the warehouse/pipeline could be possible in the
future if housing market values do not recover.
Income from trading activities was $2.7 billion in 2009,
up from $275 million a year ago. This increase was driven
by $1.8 billion in investment banking activities in our fixed
income, financial products, equities and municipal businesses
in large part due to Wachovia’s investment banking business.
The majority of the remaining 2009 trading gains were
driven by various hedging activities of interest rate and credit
exposures using cash and derivative trading instruments.
Net losses on debt securities available for sale were
$127 million in 2009, compared with net gains of $1.0 billion a
year ago. Net gains from equity investments were $185 million
in 2009, compared with net losses of $757 million in 2008,
which included a $334 million gain from our ownership
interest in Visa, which completed its initial public offering in
March 2008. Net gains and losses on debt and equity securities
totaled $58 million, after OTTI write-downs of $1.7 billion, in
2009 and $280 million, after OTTI write-downs of $2.0 billion,
in 2008. The 2008 OTTI write-downs included $646 million for
securities of Fannie Mae, Freddie Mac and Lehman Brothers.
Noninterest Expense
The increase in noninterest expense to $49.0 billion in 2009
from a year ago was predominantly due to the acquisition of
Wachovia, increased staffing and other costs related to problem
loan modifications and workouts, special deposit assessments
and operating losses. The acquisition of Wachovia resulted in
an expanded geographic platform and capabilities in businesses
such as retail brokerage, asset management and investment
banking. As part of our integration investment to enhance
both the short- and long-term benefits to our customers, we
added sales and service team members to align Wachovia’s
banking stores and other distribution channels with Wells Fargo’s
model. Commission and incentive compensation expense
increased proportionately more than salaries due to higher
2009 revenues generated by businesses with revenue-based
compensation, including the retail securities brokerage business
acquired from Wachovia and our mortgage business.
Noninterest expense included $895 million of Wachovia
merger-related integration expense for 2009. Employee bene-
fit expense in 2009 reflected actions related to freezing the
Wells Fargo and Wachovia Cash Balance pension plans, which
lowered pension cost by approximately $500 million for 2009,
and reflected $150 million of additional expense for a 401(k)
profit sharing contribution to all eligible team members.
See Note 19 (Employee Benefits and Other Expenses) to
Financial Statements in this Report for additional information.
Salaries and employee benefits also reflected increased
staffing levels to handle the higher volume of mortgage loan
modifications, which continued to increase throughout 2009,
driven by both federal and our own proprietary loan modifica-
tion programs to help customers stay in their homes. FDIC
and other deposit assessments, which included additional
assessments related to the FDIC Transaction Account
Guarantee Program in 2009, were $1.8 billion in 2009, including
a mid-year 2009 FDIC special assessment of $565 million.
See the “Risk Management – Liquidity and Funding” section
in this Report for additional information. Operating losses
included a $261 million reserve for an auction rate securities
(ARS) settlement. See Note 8 (Securitizations and Variable
Interest Entities) to Financial Statements in this Report for
more information.
Income Tax Expense
Our effective income tax rate was 30.3% in 2009, up from
18.5% in 2008. The increase is primarily attributable to higher
pre-tax earnings and increased tax expense (with a comparable
increase in interest income) associated with purchase accounting
for leveraged leases, partially offset by higher levels of tax
exempt income, tax credits and the impact of changes in our
liability for uncertain tax positions. We recognized a net tax
benefit of approximately $150 million and $200 million during
the fourth quarter and year-ended December 31, 2009, respectively,
primarily related to changes in our uncertain tax positions,
due to federal and state income tax settlements.
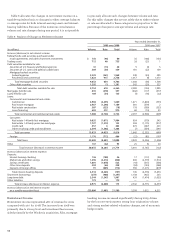
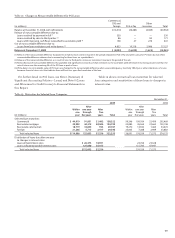
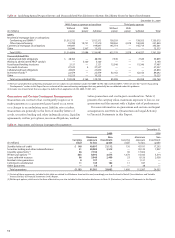
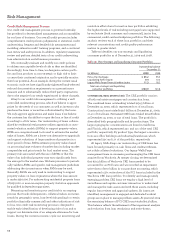
Table 8: Noninterest Expense
Year endedDecember 31,
(in millions) 2009 2008 2007
Salaries $13,757 8,260 7,762
Commission and incentive compensation 8,021 2,676 3,284
Employee benefits 4,689 2,004 2,322
Equipment 2,506 1,357 1,294
Net occupancy 3,127 1,619 1,545
Core deposit and other intangibles 2,577 186 158
FDIC and other deposit assessments 1,849 120 34
Outside professional services 1,982 847 899
Contract services 1,088 407 448
Foreclosed assets 1,071 414 256
Outside data processing 1,027 480 482
Postage, stationery and supplies 933 556 565
Operating losses 875 142 437
Insurance 845 725 416
Telecommunications 610 321 321
Travel and entertainment 575 447 474
Advertising and promotion 572 378 412
Operating leases 227 389 561
All other 2,689 1,270 1,076
Total $49,020 22,598 22,746