Wells Fargo 2009 Annual Report Download - page 64
Download and view the complete annual report
Please find page 64 of the 2009 Wells Fargo annual report below. You can navigate through the pages in the report by either clicking on the pages listed below, or by using the keyword search tool below to find specific information within the annual report.-
 1
1 -
2
-
3
-
4
-
5
-
6
-
7
-
8
-
9
-
10
-
11
-
12
-
13
-
14
-
15
-
16
-
17
-
18
-
19
-
20
-
21
-
22
-
23
-
24
-
25
-
26
-
27
-
28
-
29
-
30
-
31
-
32
-
33
-
34
-
35
-
36
-
37
-
38
-
39
-
40
-
41
-
42
-
43
-
44
-
45
-
46
-
47
-
48
-
49
-
50
-
51
-
52
-
53
-
 54
54 -
 55
55 -
 56
56 -
 57
57 -
 58
58 -
 59
59 -
 60
60 -
 61
61 -
 62
62 -
 63
63 -
 64
64 -
 65
65 -
 66
66 -
 67
67 -
 68
68 -
 69
69 -
 70
70 -
 71
71 -
 72
72 -
 73
73 -
 74
74 -
75
-
76
-
77
-
78
-
79
-
80
-
81
-
82
-
83
-
84
-
85
-
86
-
87
-
88
-
89
-
90
-
91
-
92
-
93
-
94
-
95
-
96
-
97
-
98
-
99
-
100
-
101
-
102
-
103
-
104
-
105
-
106
-
107
-
108
-
109
-
110
-
111
-
112
-
113
-
114
-
115
-
116
-
117
-
118
-
119
-
120
-
121
-
122
-
123
-
124
-
125
-
126
-
127
-
128
-
129
-
130
-
131
-
132
-
133
-
134
-
135
-
136
-
137
-
138
-
139
-
140
-
141
-
142
-
143
-
144
-
145
-
146
-
147
-
148
-
149
-
150
-
151
-
152
-
153
-
154
-
155
-
156
-
157
-
158
-
159
-
160
-
161
-
162
-
163
-
164
-
165
-
166
-
167
-
168
-
169
-
170
-
171
-
172
-
173
-
174
-
175
-
176
-
177
-
178
-
179
-
180
-
181
-
182
-
183
-
184
-
185
-
186
-
187
-
188
-
189
-
190
-
191
-
192
-
193
-
194
-
195
-
196
 |
 |

While commercial and CRE nonaccrual loans were up in
2009, the dollar amount of the increase declined between
quarters and the rate of growth slowed considerably through-
out the year. Commercial and CRE nonaccrual loans increased
$8.6 billion, or 295%, from December 31, 2008. Similarly, the
growth rate in consumer nonaccrual loans also slowed in
2009. Wells Fargo’s consumer nonaccrual loans increased
$8.9 billion, or 233%, from December 31, 2008. Wachovia’s
Pick-a-Pay portfolio represents the largest portion of con-
sumer nonaccrual loans and was up $3.3 billion in 2009.
Total consumer TDRs amounted to $8.3 billion at December 31,
2009, compared with $1.6 billion at December 31, 2008. Of the
TDRs, $2.1 billion at December 31, 2009, and $409 million at
December 31, 2008, were classified as nonaccrual. Consumer
loans that enter into a TDR before they reach nonaccrual status
(normally 120 days past due) remain in accrual status as long
as they continue to perform according to the terms of the
TDR. We strive to identify troubled loans and work with the
customer to modify to more affordable terms before their loan
reaches nonaccrual status. Accordingly, during 2009 most
consumer loans were in accrual status at the time of TDR and
therefore most of our consumer TDR loans are in accrual status
at the end of the year. We establish an impairment reserve
when a loan is restructured in a TDR.
At December 31, 2008, total nonaccrual loans were
$6.8 billion (0.79% of total loans) up from $2.7 billion (0.70%)
at December 31, 2007. A significant portion of the $4.1 billion
increase in nonaccrual loans was in the real estate 1-4 family
first mortgage portfolio, including $742 million in Wells Fargo
Financial real estate and $424 million in Wells Fargo Home
Mortgage, and was due to the national rise in mortgage
default rates. Total NPAs were $9.0 billion (1.04% of total
loans) at December 31, 2008, compared with $3.9 billion
(1.01%) at December 31, 2007. Total NPAs at December 31,
2008, excluded $20.0 billion of PCI loans that were previously
reflected as nonperforming by Wachovia.
We expect NPAs to continue to grow, in part reflecting our
efforts to modify more real estate loans to reduce foreclosures
and keep customers in their homes. We remain focused on
proactively identifying problem credits, moving them to non-
performing status and recording the loss content in a timely
manner. We have increased and will continue to increase
staffing in our workout and collection organizations to ensure
these troubled borrowers receive the attention and help they
need. See the “Risk Management – Allowance for Credit
Losses” section in this Report for additional discussion.
The performance of any one loan can be affected by external
factors, such as economic or market conditions, or factors
affecting a particular borrower.
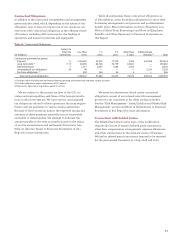
If interest due on the book balances of all nonaccrual loans
(including loans that were, but are no longer on nonaccrual
at year end) had been accrued under the original terms,
approximately $815 million of interest would have been
recorded as income in 2009, compared with $71 million
recorded as interest income.
At December 31, 2009, substantially all of our foreclosed
assets of $3.2 billion have been in the portfolio one year or less.
LOANS DAYS OR MORE PAST DUE AND STILL ACCRUING
Loans included in this category are 90 days or more past due
as to interest or principal and still accruing, because they are
(1) well-secured and in the process of collection or (2) real
estate 1-4 family first mortgage loans or consumer loans exempt
under regulatory rules from being classified as nonaccrual.
PCI loans are excluded from the disclosure of loans 90 days or
more past due and still accruing interest. Even though certain
of them are 90 days or more contractually past due, they are
considered to be accruing because the interest income on
these loans relates to the establishment of an accretable yield
under the accounting for PCI loans and not to contractual
interest payments.
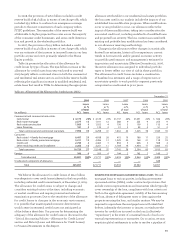
Loans 90 days or more past due and still accruing totaled
$22.2 billion, $11.8 billion, $6.4 billion, $5.1 billion and $3.6 billion
at December 31, 2009, 2008, 2007, 2006 and 2005, respectively.
The total included $15.3 billion, $8.2 billion, $4.8 billion,
$3.9 billion and $2.9 billion for the same dates, respectively,
in advances pursuant to our servicing agreements to GNMA
mortgage pools and similar loans whose repayments are
insured by the FHA or guaranteed by the VA.
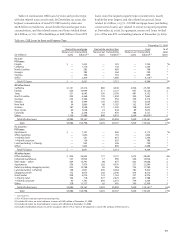
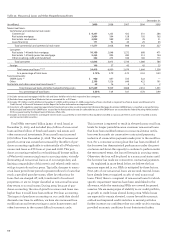
Table 27 reflects loans 90 days or more past due and still
accruing excluding the insured/guaranteed GNMA and
similar loans.
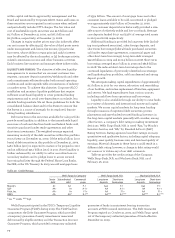
Table 27: Loans 90 Days or More Past Due and Still Accruing
(Excluding Insured/Guaranteed GNMA and Similar Loans)
December 31,
(in millions) 2009 2008 2007 2006 2005
Commercial and
commercial real estate:
Commercial $ 590 218 32 15 18
Real estate mortgage 1,183 88 10 3 13
Real estate construction 740 232 24 3 9
Total commercial
and commercial
real estate 2,513 538 66 21 40
Consumer:
Real estate
1-4 family
first mortgage (1) 1,623 883 286 154 103
Real estate
1-4 family junior
lien mortgage 515 457 201 63 50
Credit card 795 687 402 262 159
Other revolving credit
and installment 1,333 1,047 552 616 290
Total consumer 4,266 3,074 1,441 1,095 602
Foreign 73 34 52 44 41
Total $6,852 3,646 1,559 1,160 683
(1) Includes mortgage loans held for sale 90 days or more past due and still accruing.
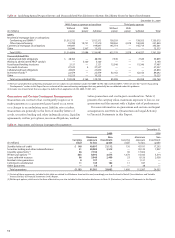
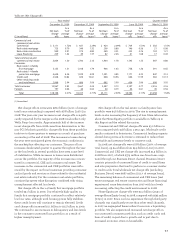
NET CHARGE-OFFS Table 28 presents net charge-offs for the
four quarters and full year of 2009.