Wells Fargo 2009 Annual Report Download - page 162
Download and view the complete annual report
Please find page 162 of the 2009 Wells Fargo annual report below. You can navigate through the pages in the report by either clicking on the pages listed below, or by using the keyword search tool below to find specific information within the annual report.-
 1
1 -
2
-
3
-
4
-
5
-
6
-
7
-
8
-
9
-
10
-
11
-
12
-
13
-
14
-
15
-
16
-
17
-
18
-
19
-
20
-
21
-
22
-
23
-
24
-
25
-
26
-
27
-
28
-
29
-
30
-
31
-
32
-
33
-
34
-
35
-
36
-
37
-
38
-
39
-
40
-
41
-
42
-
43
-
44
-
45
-
46
-
47
-
48
-
49
-
50
-
51
-
52
-
53
-
54
-
55
-
56
-
57
-
58
-
59
-
60
-
61
-
62
-
63
-
64
-
65
-
66
-
67
-
68
-
69
-
70
-
71
-
72
-
73
-
74
-
75
-
76
-
77
-
78
-
79
-
80
-
81
-
82
-
83
-
84
-
85
-
86
-
87
-
88
-
89
-
90
-
91
-
92
-
93
-
94
-
95
-
96
-
97
-
98
-
99
-
100
-
101
-
102
-
103
-
104
-
105
-
106
-
107
-
108
-
109
-
110
-
111
-
112
-
113
-
114
-
115
-
116
-
117
-
118
-
119
-
120
-
121
-
122
-
123
-
124
-
125
-
126
-
127
-
128
-
129
-
130
-
131
-
132
-
133
-
134
-
135
-
136
-
137
-
138
-
139
-
140
-
141
-
142
-
143
-
144
-
145
-
146
-
147
-
148
-
149
-
150
-
151
-
 152
152 -
 153
153 -
 154
154 -
 155
155 -
 156
156 -
 157
157 -
 158
158 -
 159
159 -
 160
160 -
 161
161 -
 162
162 -
 163
163 -
 164
164 -
 165
165 -
 166
166 -
 167
167 -
 168
168 -
 169
169 -
 170
170 -
 171
171 -
 172
172 -
173
-
174
-
175
-
176
-
177
-
178
-
179
-
180
-
181
-
182
-
183
-
184
-
185
-
186
-
187
-
188
-
189
-
190
-
191
-
192
-
193
-
194
-
195
-
196
 |
 |

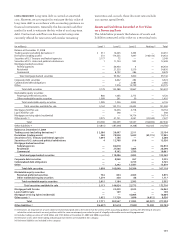
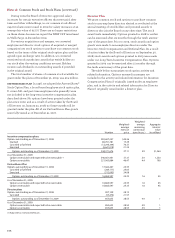
Disclosures about Fair Value of Financial Instruments
The table below is a summary of fair value estimates for
financial instruments, excluding short-term financial assets
and liabilities because carrying amounts approximate fair
value, and excluding financial instruments recorded at fair
value on a recurring basis. The carrying amounts in the
following table are recorded in the balance sheet under the
indicated captions.
We have not included assets and liabilities that are not
financial instruments in our disclosure, such as the value of
the long-term relationships with our deposit, credit card and
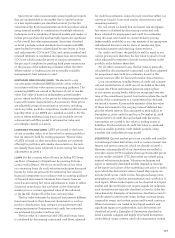
Note 16: Fair Values of Assets and Liabilities (continued)
trust customers, amortized MSRs, premises and equipment,
goodwill and other intangibles, deferred taxes and other
liabilities. The total of the fair value calculations presented
does not represent, and should not be construed to represent,
the underlying value of the Company.
The carrying amount of loans at December 31, 2008, in the
table below includes $443.5 billion acquired from Wachovia.
Under the purchase method of accounting, these loans were
recorded at fair value upon acquisition, and accordingly,
the carrying value and fair value at December 31, 2008 were
the same.
Year ended December 31,
2009 2008
Carrying Estimated Carrying Estimated
(in millions) amount fair value amount fair value
Financial assets
Mortgages held for sale (1) $ 2,132 2,132 1,334 1,333
Loans held for sale (2) 5,584 5,719 5,830 5,876
Loans, net (3) 744,225 717,798 828,123 813,950
Nonmarketable equity investments (cost method) 9,793 9,889 9,146 9,262
Financial liabilities
Deposits 824,018 824,678 781,402 781,964
Long-term debt (4) 203,784 205,752 267,055 266,023
(1) Balance excludes mortgages held for sale for which the fair value option under ASC 825-10 was elected, and therefore includes nonprime residential and commercial
mortgages held for sale.
(2) Balance excludes loans held for sale for which the fair value option under ASC 825-10 was elected.
(3) Balance excludes lease financing with a carrying amount of $14.2 billion at December 31, 2009, and $15.8 billion at December 31, 2008.
(4) The carrying amount and fair value exclude obligations under capital leases of $77 million at December 31, 2009, and $103 million at December 31, 2008.
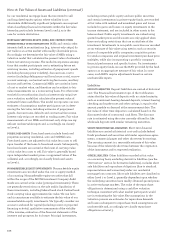
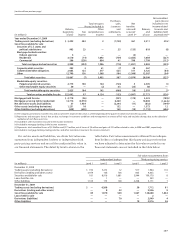
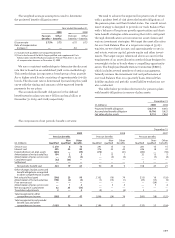
Alternative Investments
The following table summarizes our investments in various
types of funds. We use the funds’ NAVs per share as a practical
expedient to measure fair value on recurring and nonrecur-
ring bases. The fair values presented in the table are based
upon the funds’ NAVs or an equivalent measure.
December 31, 2009
Redemption
Fair Unfunded Redemption notice
(in millions) value commitments frequency period
Offshore funds (1) $1,270 — Daily- Quarterly 1-90 days
Funds of funds (2) 69 — Monthly-Annually 10-120 days
Hedge funds (3) 35 — Monthly -Annually 30-180 days
Private equity funds (4) 901 340 N/A N/A
Venture capital funds (5) 93 47 N/A N/A
Total $2,368 387
N/A – Not applicable.
(1) Includes investments in funds that invest primarily in investment grade European fixed-income securities. Redemption restrictions are in place for investments with
a fair value of $76 million due to a lock-up provision that will remain in effect until November 2012.
(2) Represents funds that invest principally in publicly listed equity securities. For one investment valued at $3 million, a gate provision has been imposed by the fund
manager, and no redemptions are currently allowed. This redemption restriction will remain in effect until January 2012.
(3) Consists of investments in equity, multi-strategy, and event driven hedge funds. Redemption restrictions are in place for investments with a fair value of $10 million
primarily because the funds are subject to lock-up provisions or are in the process of liquidating. The redemption restrictions are expected to remain in effect until
January 2012.
(4) Includes private equity funds that invest in equity and debt securities issued by private and publicly-held companies in connection with leveraged buy-outs,
recapitalizations, and expansion opportunities. Substantially all of these investments do not allow redemptions. Alternatively, we receive distributions as the underlying
assets of the funds liquidate, which we expect to occur over the next 10 years. We have begun withdrawal proceedings for investments with a fair value of $63 million
and a 90-day redemption notice period. We expect to receive most of these funds by March 31, 2013.
(5) Represents investments in funds that invest in domestic and foreign companies in a variety of industries, including information technology, financial services,
and healthcare. These investments can never be redeemed with the funds. Instead, we receive distributions as the underlying assets of the fund liquidate,
which we expect to occur over the next 7 years.