Wells Fargo 2009 Annual Report Download - page 48
Download and view the complete annual report
Please find page 48 of the 2009 Wells Fargo annual report below. You can navigate through the pages in the report by either clicking on the pages listed below, or by using the keyword search tool below to find specific information within the annual report.-
 1
1 -
2
-
3
-
4
-
5
-
6
-
7
-
8
-
9
-
10
-
11
-
12
-
13
-
14
-
15
-
16
-
17
-
18
-
19
-
20
-
21
-
22
-
23
-
24
-
25
-
26
-
27
-
28
-
29
-
30
-
31
-
32
-
33
-
34
-
35
-
36
-
37
-
 38
38 -
 39
39 -
 40
40 -
 41
41 -
 42
42 -
 43
43 -
 44
44 -
 45
45 -
 46
46 -
 47
47 -
 48
48 -
 49
49 -
 50
50 -
 51
51 -
 52
52 -
 53
53 -
 54
54 -
 55
55 -
 56
56 -
 57
57 -
 58
58 -
59
-
60
-
61
-
62
-
63
-
64
-
65
-
66
-
67
-
68
-
69
-
70
-
71
-
72
-
73
-
74
-
75
-
76
-
77
-
78
-
79
-
80
-
81
-
82
-
83
-
84
-
85
-
86
-
87
-
88
-
89
-
90
-
91
-
92
-
93
-
94
-
95
-
96
-
97
-
98
-
99
-
100
-
101
-
102
-
103
-
104
-
105
-
106
-
107
-
108
-
109
-
110
-
111
-
112
-
113
-
114
-
115
-
116
-
117
-
118
-
119
-
120
-
121
-
122
-
123
-
124
-
125
-
126
-
127
-
128
-
129
-
130
-
131
-
132
-
133
-
134
-
135
-
136
-
137
-
138
-
139
-
140
-
141
-
142
-
143
-
144
-
145
-
146
-
147
-
148
-
149
-
150
-
151
-
152
-
153
-
154
-
155
-
156
-
157
-
158
-
159
-
160
-
161
-
162
-
163
-
164
-
165
-
166
-
167
-
168
-
169
-
170
-
171
-
172
-
173
-
174
-
175
-
176
-
177
-
178
-
179
-
180
-
181
-
182
-
183
-
184
-
185
-
186
-
187
-
188
-
189
-
190
-
191
-
192
-
193
-
194
-
195
-
196
 |
 |
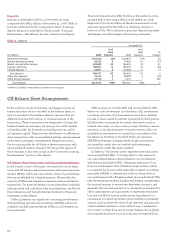
Key merger achievements included the conversion of
Wachovia offices to the commercial banking model, revenue
synergies through our government banking and global finan-
cial institutions and trade services businesses and enhance-
ment of our investment banking business across the franchise
by combining the best of the two companies’ advisory,
financing and securities distribution capabilities.
Wealth, Brokerage and Retirement provides a full range of
financial advisory services to clients. Wealth Management
provides affluent and high-net-worth clients with a complete
range of wealth management solutions including financial
planning, private banking, credit, investment management,
trust and estate services, business succession planning and
charitable services along with bank-based brokerage services
through Wells Fargo Advisors and Wells Fargo Investments,
LLC. Family Wealth provides family-office services to ultra-
high-net-worth clients and is one of the largest multi-family
financial office practices in the United States. Retail Brokerage’s
financial advisors serve customers’ advisory, brokerage
and financial needs as part of one of the largest full-service
brokerage firms in the United States. Retirement provides
retirement services for individual investors and is a national
leader in 401(k) and pension record keeping. The addition of
Wachovia in first quarter 2009 added the following businesses
to this operating segment: Wells Fargo Advisors (retail
brokerage), wealth management, including its family wealth
business, and retirement and reinsurance business.
Wealth, Brokerage and Retirement earned net income of
$1.0 billion in 2009. Revenue of $11.5 billion included a mix
of brokerage commissions, asset-based fees and net interest
income. The equity market recovery helped drive growth in
fee income. Deposit balances grew 33% during the year. Net
interest income growth was dampened by the exceptionally
low short-term interest rate environment. Expenses increased
from the prior year due to the addition of Wachovia and the
loss reserve for the ARS legal settlement. Expense growth was
mitigated by the realization of merger synergies during the
year. The wealth, brokerage and retirement businesses have
solidified partnerships throughout Wells Fargo, working with
Community Banking and Wholesale Banking to provide
financial solutions for clients.
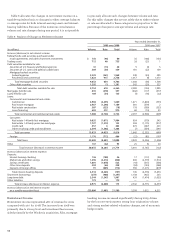
Earnings Performance – Comparison of with
Wells Fargo net income in 2008 was $2.7 billion ($0.70 per
common share), compared with $8.1 billion ($2.38 per common
share) in 2007. Results for 2008 included the impact of our
$8.1 billion (pre tax) credit reserve build, $2.0 billion (pre tax)
of OTTI and $124 million (pre tax) of merger-related expenses.
Results for 2007 included the impact of our $1.4 billion
(pre tax) credit reserve build and $203 million (pre tax) of
Visa litigation expenses. Despite the challenging environment
in 2008, we achieved both top line revenue growth and
positive operating leverage (revenue growth of 6%; expense
decline of 1%).
Revenue, the sum of net interest income and noninterest
income, grew 6% to $41.9 billion in 2008 from $39.5 billion in
2007. The breadth and depth of our business model resulted
in very strong and balanced growth in loans, deposits and
fee-based products. We achieved positive operating leverage
(revenue growth of 6%; expense decline of 1%), the best
among large bank peers. Wells Fargo net income for 2008 of
$2.7 billion included an $8.1 billion (pre tax) credit reserve
build, $2.0 billion (pre tax) of OTTI and $124 million (pre tax)
of merger-related expenses. Diluted earnings per share of
$0.70 for 2008 included credit reserve build ($1.51 per share)
and OTTI ($0.37 per share). Industry-leading annual results
included the highest growth in pre-tax pre-provision earnings
(up 15%), highest net interest margin (4.83%), return on average
common stockholders’ equity (ROE), return on average total
assets (ROA) and highest total shareholder return among
large bank peers (up 2%).
Net interest income on a taxable-equivalent basis was
$25.4 billion in 2008, up from $21.1 billion in 2007, reflecting
strong loan growth, disciplined deposit pricing and lower
market funding costs. Average earning assets grew 17% from
2007. Our net interest margin was 4.83% for 2008, up from
4.74% in 2007, primarily due to the benefit of lower funding
costs as market rates declined.
Noninterest income decreased 10% to $16.7 billion in 2008
from $18.5 billion in 2007. Card fees were up 9% from 2007,
due to continued growth in new accounts and higher credit
and debit card transaction volume. Insurance revenue was up
20%, due to customer growth, higher crop insurance revenue
and the fourth quarter 2007 acquisition of ABD Insurance.
However, trust and investment fees decreased 7% and other
fees decreased 9%, due to depressed market conditions.
Operating lease income decreased 39% from 2007, due to
continued softening in the auto market, reflecting tightened
credit standards. Noninterest income included $280 million in
net gains on debt and equity securities, including $2.0 billion
of OTTI write-downs.
Noninterest expense was $22.6 billion in 2008, down 1%
from $22.7 billion in 2007. We continued to invest in new
stores and additional sales and service-related team members.
Operating lease expense decreased 31% to $389 million in
2008 from $561 million in 2007, as we stopped originating
new indirect auto leases in third quarter 2008. Insurance
expense increased to $725 million in 2008 from $416 million
in 2007 due to the fourth quarter 2007 acquisition of ABD
Insurance, additional insurance reserves at our captive
mortgage reinsurance operation as well as higher
commissions on increased sales volume.