Wells Fargo 2009 Annual Report Download - page 50
Download and view the complete annual report
Please find page 50 of the 2009 Wells Fargo annual report below. You can navigate through the pages in the report by either clicking on the pages listed below, or by using the keyword search tool below to find specific information within the annual report.-
 1
1 -
2
-
3
-
4
-
5
-
6
-
7
-
8
-
9
-
10
-
11
-
12
-
13
-
14
-
15
-
16
-
17
-
18
-
19
-
20
-
21
-
22
-
23
-
24
-
25
-
26
-
27
-
28
-
29
-
30
-
31
-
32
-
33
-
34
-
35
-
36
-
37
-
38
-
39
-
 40
40 -
 41
41 -
 42
42 -
 43
43 -
 44
44 -
 45
45 -
 46
46 -
 47
47 -
 48
48 -
 49
49 -
 50
50 -
 51
51 -
 52
52 -
 53
53 -
 54
54 -
 55
55 -
 56
56 -
 57
57 -
 58
58 -
 59
59 -
 60
60 -
61
-
62
-
63
-
64
-
65
-
66
-
67
-
68
-
69
-
70
-
71
-
72
-
73
-
74
-
75
-
76
-
77
-
78
-
79
-
80
-
81
-
82
-
83
-
84
-
85
-
86
-
87
-
88
-
89
-
90
-
91
-
92
-
93
-
94
-
95
-
96
-
97
-
98
-
99
-
100
-
101
-
102
-
103
-
104
-
105
-
106
-
107
-
108
-
109
-
110
-
111
-
112
-
113
-
114
-
115
-
116
-
117
-
118
-
119
-
120
-
121
-
122
-
123
-
124
-
125
-
126
-
127
-
128
-
129
-
130
-
131
-
132
-
133
-
134
-
135
-
136
-
137
-
138
-
139
-
140
-
141
-
142
-
143
-
144
-
145
-
146
-
147
-
148
-
149
-
150
-
151
-
152
-
153
-
154
-
155
-
156
-
157
-
158
-
159
-
160
-
161
-
162
-
163
-
164
-
165
-
166
-
167
-
168
-
169
-
170
-
171
-
172
-
173
-
174
-
175
-
176
-
177
-
178
-
179
-
180
-
181
-
182
-
183
-
184
-
185
-
186
-
187
-
188
-
189
-
190
-
191
-
192
-
193
-
194
-
195
-
196
 |
 |

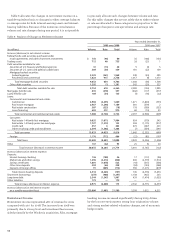
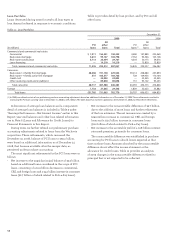
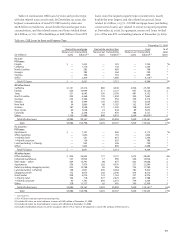
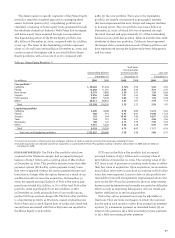
Loan Portfolio
Loans decreased during 2009 for nearly all loan types as
loan demand softened in response to economic conditions.
Table 11 provides detail by loan product, and by PCI and all
other loans.
A discussion of average loan balances and a comparative
detail of average loan balances is included in Table 5 under
“Earnings Performance – Net Interest Income” earlier in this
Report; year-end balances and other loan related information
are in Note 6 (Loans and Allowance for Credit Losses) to
Financial Statements in this Report.
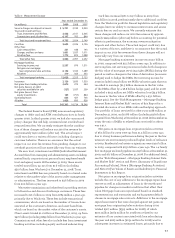
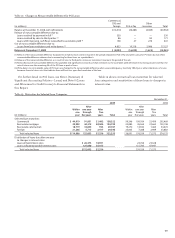
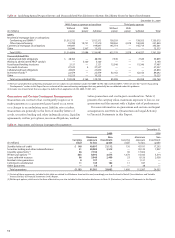
During 2009, we further refined our preliminary purchase
accounting adjustments related to loans from the Wachovia
acquisition. These refinements, which increased the
December 31, 2008, balance of PCI loans to $59.2 billion,
were based on additional information as of December 31,
2008, that became available after the merger date, as
permitted under purchase accounting.
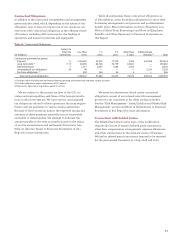
The most significant refinements for the PCI loans were as
follows:
• Net increase to the unpaid principal balance of $2.3 billion
based on additional loans considered in the scope of PCI
loans, consisting of a $1.9 billion decrease in commercial,
CRE, and foreign loans and a $4.2 billion increase in consumer
loans ($2.7 billion of which related to Pick-a-Pay loans).
• Net increase to the nonaccretable difference of $3.7 billion,
due to the addition of more loans and further refinement
of the loss estimates. The net increase was created by a
$299 million increase in commercial, CRE, and foreign
loans and a $3.4 billion increase in consumer loans
($2.2 billion of which related to Pick-a-Pay loans).
• Net increase to the accretable yield of a $1.8 billion interest
rate mark premium, primarily for consumer loans.
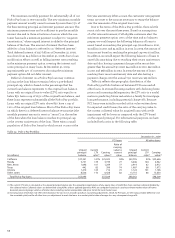
The nonaccretable difference was established in purchase
accounting for PCI loans to absorb losses expected at that
time on those loans. Amounts absorbed by the nonaccretable
difference do not affect the income statement or the
allowance for credit losses. Table 12 provides an analysis
of 2009 changes in the nonaccretable difference related to
principal that is not expected to be collected.
Table 11: Loan Portfolios
December 31,
2009 2008
All All
PCI other PCI other
(in millions) loans loans Total loans(1) loans Total
Commercial and commercial real estate:
Commercial $ 1,911 156,441 158,352 4,580 197,889 202,469
Real estate mortgage 5,631 99,167 104,798 7,762 95,346 103,108
Real estate construction 3,713 25,994 29,707 4,503 30,173 34,676
Lease financing — 14,210 14,210 — 15,829 15,829
Total commercial and commercial real estate 11,255 295,812 307,067 16,845 339,237 356,082
Consumer:
Real estate 1-4 family first mortgage 38,386 191,150 229,536 39,214 208,680 247,894
Real estate 1-4 family junior lien mortgage 331 103,377 103,708 728 109,436 110,164
Credit card — 24,003 24,003 — 23,555 23,555
Other revolving credit and installment — 89,058 89,058 151 93,102 93,253
Total consumer 38,717 407,588 446,305 40,093 434,773 474,866
Foreign 1,733 27,665 29,398 1,859 32,023 33,882
Total loans $51,705 731,065 782,770 58,797 806,033 864,830
(1) In 2009, we refined certain of our preliminary purchase accounting adjustments based on additional information as of December 31, 2008. These refinements resulted in
increasing the PCI loans carrying value at December 31, 2008, to $59.2 billion. The table above has not been updated as of December 31, 2008, to reflect these refinements.