Wells Fargo 2009 Annual Report Download - page 77
Download and view the complete annual report
Please find page 77 of the 2009 Wells Fargo annual report below. You can navigate through the pages in the report by either clicking on the pages listed below, or by using the keyword search tool below to find specific information within the annual report.-
 1
1 -
2
-
3
-
4
-
5
-
6
-
7
-
8
-
9
-
10
-
11
-
12
-
13
-
14
-
15
-
16
-
17
-
18
-
19
-
20
-
21
-
22
-
23
-
24
-
25
-
26
-
27
-
28
-
29
-
30
-
31
-
32
-
33
-
34
-
35
-
36
-
37
-
38
-
39
-
40
-
41
-
42
-
43
-
44
-
45
-
46
-
47
-
48
-
49
-
50
-
51
-
52
-
53
-
54
-
55
-
56
-
57
-
58
-
59
-
60
-
61
-
62
-
63
-
64
-
65
-
66
-
 67
67 -
 68
68 -
 69
69 -
 70
70 -
 71
71 -
 72
72 -
 73
73 -
 74
74 -
 75
75 -
 76
76 -
 77
77 -
 78
78 -
 79
79 -
 80
80 -
 81
81 -
 82
82 -
 83
83 -
 84
84 -
 85
85 -
 86
86 -
 87
87 -
88
-
89
-
90
-
91
-
92
-
93
-
94
-
95
-
96
-
97
-
98
-
99
-
100
-
101
-
102
-
103
-
104
-
105
-
106
-
107
-
108
-
109
-
110
-
111
-
112
-
113
-
114
-
115
-
116
-
117
-
118
-
119
-
120
-
121
-
122
-
123
-
124
-
125
-
126
-
127
-
128
-
129
-
130
-
131
-
132
-
133
-
134
-
135
-
136
-
137
-
138
-
139
-
140
-
141
-
142
-
143
-
144
-
145
-
146
-
147
-
148
-
149
-
150
-
151
-
152
-
153
-
154
-
155
-
156
-
157
-
158
-
159
-
160
-
161
-
162
-
163
-
164
-
165
-
166
-
167
-
168
-
169
-
170
-
171
-
172
-
173
-
174
-
175
-
176
-
177
-
178
-
179
-
180
-
181
-
182
-
183
-
184
-
185
-
186
-
187
-
188
-
189
-
190
-
191
-
192
-
193
-
194
-
195
-
196
 |
 |
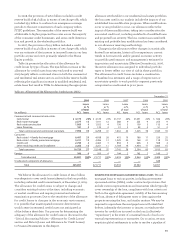
collected at acquisition using our internal credit risk, interest
rate risk and prepayment risk models, which incorporate our
best estimate of current key assumptions, such as property
values, default rates, loss severity and prepayment speeds.
Under the accounting guidance for PCI loans, the excess
of cash flows expected to be collected over the estimated fair
value is referred to as the accretable yield and is recognized
in interest income over the remaining life of the loan, or pool
of loans, in situations where there is a reasonable expectation
about the timing and amount of cash flows expected to be
collected. The difference between the contractually required
payments and the cash flows expected to be collected at
acquisition, considering the impact of prepayments, is
referred to as the nonaccretable difference.
In addition, subsequent to acquisition, we are required to
periodically evaluate our estimate of cash flows expected to
be collected. These evaluations, performed quarterly, require
the continued usage of key assumptions and estimates, simi-
lar to the initial estimate of fair value. Given the current eco-
nomic environment, we must apply judgment to develop our
estimates of cash flows for PCI loans given the impact of home
price and property value changes, changing loss severities
and prepayment speeds. Decreases in the expected cash flows
will generally result in a charge to the provision for credit
losses resulting in an increase to the allowance for loan losses.
Increases in the expected cash flows will generally result in
an increase in interest income over the remaining life of the
loan, or pool of loans. Disposals of loans, which may include
sales of loans to third parties, receipt of payments in full or
part by the borrower, and foreclosure of the collateral, result
in removal of the loan from the PCI loan portfolio at its carrying
amount. The amount of cash flows expected to be collected
and, accordingly, the adequacy of the allowance for loan loss
due to certain decreases in expected cash flow, is particularly
sensitive to changes in loan credit quality. The sensitivity of
the overall allowance for loan losses, including PCI loans, to
a one risk downgrade is presented in the preceding section,
“Critical Accounting Policies – Allowance for Credit Losses.”
We aggregated loans acquired in the same fiscal quarter
into one or more pools, provided that the loans have common
risk characteristics. A pool is then accounted for as a single
asset with a single composite interest rate and an aggregate
expectation of cash flows. We aggregated all of the consumer
loans and commercial and CRE loans with balances of $3 mil-
lion or less into pools with common risk characteristics. We
accounted for commercial and CRE loans with balances in
excess of $3 million individually.
PCI loans that were classified as nonperforming loans by
Wachovia are no longer classified as nonperforming because,
at acquisition, we believe we will fully collect the new carrying
value of these loans. It is important to note that judgment is
required to classify PCI loans as performing, and is dependent
on having a reasonable expectation about the timing and
amount of cash flows expected to be collected, even if the
loan is contractually past due.
See the “Risk Management – Credit Risk Management
Process” section and Note 6 (Loans and Allowance for Credit
Losses) to Financial Statements in this Report for further
discussion of PCI loans.
Valuation of Residential Mortgage Servicing Rights
We recognize as assets the rights to service mortgage loans
for others, or mortgage servicing rights (MSRs), whether we
purchase the servicing rights, or the servicing rights result
from the sale or securitization of loans we originate (asset
transfers). We also acquire MSRs under co-issuer agreements
that provide for us to service loans that are originated and
securitized by third-party correspondents. We initially mea-
sure and carry our MSRs related to residential mortgage loans
(residential MSRs) using the fair value measurement method,
under which purchased MSRs and MSRs from asset transfers
are capitalized and carried at fair value.
At the end of each quarter, we determine the fair value of
MSRs using a valuation model that calculates the present
value of estimated future net servicing income. The model
incorporates assumptions that market participants use in
estimating future net servicing income, including estimates
of prepayment speeds (including housing price volatility),
discount rate, default rates, cost to service (including delin-
quency and foreclosure costs), escrow account earnings, con-
tractual servicing fee income, ancillary income and late fees.
The valuation of MSRs is discussed further in this section
and in Note 1 (Summary of Significant Accounting Policies),
Note 8 (Securitizations and Variable Interest Entities), Note 9
(Mortgage Banking Activities) and Note 16 (Fair Values of
Assets and Liabilities) to Financial Statements in this Report.
To reduce the sensitivity of earnings to interest rate and
market value fluctuations, we may use securities available
for sale and free-standing derivatives (economic hedges) to
hedge the risk of changes in the fair value of MSRs, with the
resulting gains or losses reflected in income. Changes in the
fair value of the MSRs from changing mortgage interest rates
are generally offset by gains or losses in the fair value of the
derivatives depending on the amount of MSRs we hedge and
the particular instruments used to hedge the MSRs. We may
choose not to fully hedge MSRs, partly because origination
volume tends to act as a “natural hedge.” For example, as
interest rates decline, servicing values generally decrease and
fees from origination volume tend to increase. Conversely, as
interest rates increase, the fair value of the MSRs generally
increases, while fees from origination volume tend to decline.
See the “Risk Management – Mortgage Banking Interest Rate
and Market Risk” section in this Report for discussion of the
timing of the effect of changes in mortgage interest rates.
Net servicing income, a component of mortgage banking
noninterest income, includes the changes from period to period
in fair value of both our residential MSRs and the free-standing
derivatives (economic hedges) used to hedge our residential
MSRs. Changes in the fair value of residential MSRs from
period to period result from (1) changes in the valuation
model inputs or assumptions (principally reflecting changes
in discount rates and prepayment speed assumptions, mostly
due to changes in interest rates) and (2) other changes,
representing changes due to collection/realization of expected
cash flows.