Wells Fargo 2009 Annual Report Download - page 96
Download and view the complete annual report
Please find page 96 of the 2009 Wells Fargo annual report below. You can navigate through the pages in the report by either clicking on the pages listed below, or by using the keyword search tool below to find specific information within the annual report.-
 1
1 -
2
-
3
-
4
-
5
-
6
-
7
-
8
-
9
-
10
-
11
-
12
-
13
-
14
-
15
-
16
-
17
-
18
-
19
-
20
-
21
-
22
-
23
-
24
-
25
-
26
-
27
-
28
-
29
-
30
-
31
-
32
-
33
-
34
-
35
-
36
-
37
-
38
-
39
-
40
-
41
-
42
-
43
-
44
-
45
-
46
-
47
-
48
-
49
-
50
-
51
-
52
-
53
-
54
-
55
-
56
-
57
-
58
-
59
-
60
-
61
-
62
-
63
-
64
-
65
-
66
-
67
-
68
-
69
-
70
-
71
-
72
-
73
-
74
-
75
-
76
-
77
-
78
-
79
-
80
-
81
-
82
-
83
-
84
-
85
-
 86
86 -
 87
87 -
 88
88 -
 89
89 -
 90
90 -
 91
91 -
 92
92 -
 93
93 -
 94
94 -
 95
95 -
 96
96 -
 97
97 -
 98
98 -
 99
99 -
 100
100 -
 101
101 -
 102
102 -
 103
103 -
 104
104 -
 105
105 -
 106
106 -
107
-
108
-
109
-
110
-
111
-
112
-
113
-
114
-
115
-
116
-
117
-
118
-
119
-
120
-
121
-
122
-
123
-
124
-
125
-
126
-
127
-
128
-
129
-
130
-
131
-
132
-
133
-
134
-
135
-
136
-
137
-
138
-
139
-
140
-
141
-
142
-
143
-
144
-
145
-
146
-
147
-
148
-
149
-
150
-
151
-
152
-
153
-
154
-
155
-
156
-
157
-
158
-
159
-
160
-
161
-
162
-
163
-
164
-
165
-
166
-
167
-
168
-
169
-
170
-
171
-
172
-
173
-
174
-
175
-
176
-
177
-
178
-
179
-
180
-
181
-
182
-
183
-
184
-
185
-
186
-
187
-
188
-
189
-
190
-
191
-
192
-
193
-
194
-
195
-
196
 |
 |

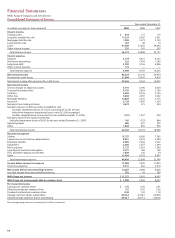
94
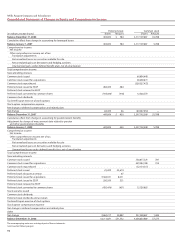
Wells Fargo & Company and Subsidiaries
Consolidated Statement of Changes in Equity and Comprehensive Income
Preferred stock Common stock
(in millions, except shares) Shares Amount Shares Amount
Balance December 31, 2008 10,111,821 $ 31,332 4,228,630,889 $7,273
Cumulative effect from change in accounting for
other-than-temporary impairment on debt securities
Effect of change in accounting for noncontrolling interests
Balance January 1, 2009 10,111,821 31,332 4,228,630,889 7,273
Comprehensive income:
Net income
Other comprehensive income, net of tax:
Translation adjustments
Securities available for sale:
Unrealized losses related to factors other than credit
All other net unrealized gains
Net unrealized losses on derivatives and hedging activities
Unamortized gains under defined benefit plans, net of amortization
Total comprehensive income
Noncontrolling interests:
Purchase of Prudential’s noncontrolling interest
All other
Common stock issued 953,285,636 1,470
Common stock repurchased (8,274,015)
Preferred stock redeemed (25,000) (25,000)
Preferred stock released to ESOP
Preferred stock converted to common shares (105,881) (106) 4,982,083
Common stock dividends
Preferred stock dividends and accretion 2,259
Tax benefit upon exercise of stock options
Stock option compensation expense
Net change in deferred compensation and related plans
Net change (130,881) (22,847) 949,993,704 1,470
Balance December 31, 2009 9,980,940 $ 8,485 5,178,624,593 $8,743
The accompanying notes are an integral part of these statements.
(continued from previous pages)