Wells Fargo 2009 Annual Report Download - page 92
Download and view the complete annual report
Please find page 92 of the 2009 Wells Fargo annual report below. You can navigate through the pages in the report by either clicking on the pages listed below, or by using the keyword search tool below to find specific information within the annual report.-
 1
1 -
2
-
3
-
4
-
5
-
6
-
7
-
8
-
9
-
10
-
11
-
12
-
13
-
14
-
15
-
16
-
17
-
18
-
19
-
20
-
21
-
22
-
23
-
24
-
25
-
26
-
27
-
28
-
29
-
30
-
31
-
32
-
33
-
34
-
35
-
36
-
37
-
38
-
39
-
40
-
41
-
42
-
43
-
44
-
45
-
46
-
47
-
48
-
49
-
50
-
51
-
52
-
53
-
54
-
55
-
56
-
57
-
58
-
59
-
60
-
61
-
62
-
63
-
64
-
65
-
66
-
67
-
68
-
69
-
70
-
71
-
72
-
73
-
74
-
75
-
76
-
77
-
78
-
79
-
80
-
81
-
 82
82 -
 83
83 -
 84
84 -
 85
85 -
 86
86 -
 87
87 -
 88
88 -
 89
89 -
 90
90 -
 91
91 -
 92
92 -
 93
93 -
 94
94 -
 95
95 -
 96
96 -
 97
97 -
 98
98 -
 99
99 -
 100
100 -
 101
101 -
 102
102 -
103
-
104
-
105
-
106
-
107
-
108
-
109
-
110
-
111
-
112
-
113
-
114
-
115
-
116
-
117
-
118
-
119
-
120
-
121
-
122
-
123
-
124
-
125
-
126
-
127
-
128
-
129
-
130
-
131
-
132
-
133
-
134
-
135
-
136
-
137
-
138
-
139
-
140
-
141
-
142
-
143
-
144
-
145
-
146
-
147
-
148
-
149
-
150
-
151
-
152
-
153
-
154
-
155
-
156
-
157
-
158
-
159
-
160
-
161
-
162
-
163
-
164
-
165
-
166
-
167
-
168
-
169
-
170
-
171
-
172
-
173
-
174
-
175
-
176
-
177
-
178
-
179
-
180
-
181
-
182
-
183
-
184
-
185
-
186
-
187
-
188
-
189
-
190
-
191
-
192
-
193
-
194
-
195
-
196
 |
 |

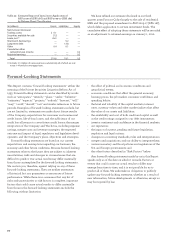
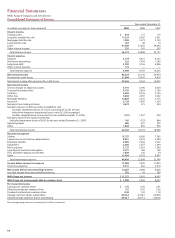
Financial Statements
Wells Fargo & Company and Subsidiaries
Consolidated Statement of Income
Year ended December 31,
(in millions, except per share amounts) 2009 2008 2007
Interest income
Trading assets $ 918 177 173
Securities available for sale 11,319 5,287 3,451
Mortgages held for sale 1,930 1,573 2,150
Loans held for sale 183 48 70
Loans 41,589 27,632 29,040
Other interest income 335 181 293
Total interest income 56,274 34,898 35,177
Interest expense
Deposits 3,774 4,521 8,152
Short-term borrowings 222 1,478 1,245
Long-term debt 5,782 3,756 4,806
Other interest expense 172 ——
Total interest expense 9,950 9,755 14,203
Net interest income 46,324 25,143 20,974
Provision for credit losses 21,668 15,979 4,939
Net interest income after provision for credit losses 24,656 9,164 16,035
Noninterest income
Service charges on deposit accounts 5,741 3,190 3,050
Trust and investment fees 9,735 2,924 3,149
Card fees 3,683 2,336 2,136
Other fees 3,804 2,097 2,292
Mortgage banking 12,028 2,525 3,133
Insurance 2,126 1,830 1,530
Net gains from trading activities 2,674 275 544
Net gains (losses) on debt securities available for sale
(includes impairment losses of $1,012, consisting of $2,352 of total
other-than-temporary impairment losses, net of $1,340 recognized
in other comprehensive income, for the year ended December 31, 2009) (127) 1,037 209
Net gains (losses) from equity investments
(includes impairment losses of $655 for the year ended December 31, 2009) 185 (757) 864
Operating leases 685 427 703
Other 1,828 850 936
Total noninterest income 42,362 16,734 18,546
Noninterest expense
Salaries 13,757 8,260 7,762
Commission and incentive compensation 8,021 2,676 3,284
Employee benefits 4,689 2,004 2,322
Equipment 2,506 1,357 1,294
Net occupancy 3,127 1,619 1,545
Core deposit and other intangibles 2,577 186 158
FDIC and other deposit assessments 1,849 120 34
Other 12,494 6,376 6,347
Total noninterest expense 49,020 22,598 22,746
Income before income tax expense 17,998 3,300 11,835
Income tax expense 5,331 602 3,570
Net income before noncontrolling interests 12,667 2,698 8,265
Less: Net income from noncontrolling interests 392 43 208
Wells Fargo net income $ 12,275 2,655 8,057
Wells Fargo net income applicable to common stock $ 7,990 2,369 8,057
Per share information
Earnings per common share $ 1.76 0.70 2.41
Diluted earnings per common share 1.75 0.70 2.38
Dividends declared per common share 0.49 1.30 1.18
Average common shares outstanding 4,545.2 3,378.1 3,348.5
Diluted average common shares outstanding 4,562.7 3,391.3 3,382.8
The accompanying notes are an integral part of these statements.